USD/INR Price Analysis: Rebounds firmly from 81.30 but the upside looks capped
|
- USD/INR has displayed a responsive buying action amid a recovery in US Treasury yields.
- The 20-and 50-EMAs are on the verge of delivering a bearish crossover around 82.15.
- A bearish range shift by the RSI (14) has triggered the downside momentum.
The USD/INR pair has witnessed a responsive buying action to near the critical support of 81.00 in the Asian session. The Indian Rupee asset has witnessed buying interest again amid a recovery in the US Treasury yields. Also, a marginal rebound in the US Dollar Index (DXY) has supported USD/INR.
Meanwhile, the S&P500 futures have sensed selling pressure as investors have trimmed their longs in Asia after remaining bullish in the past three trading sessions. The US Dollar Index is aiming to shift its auction profile above the critical resistance of 102.00.
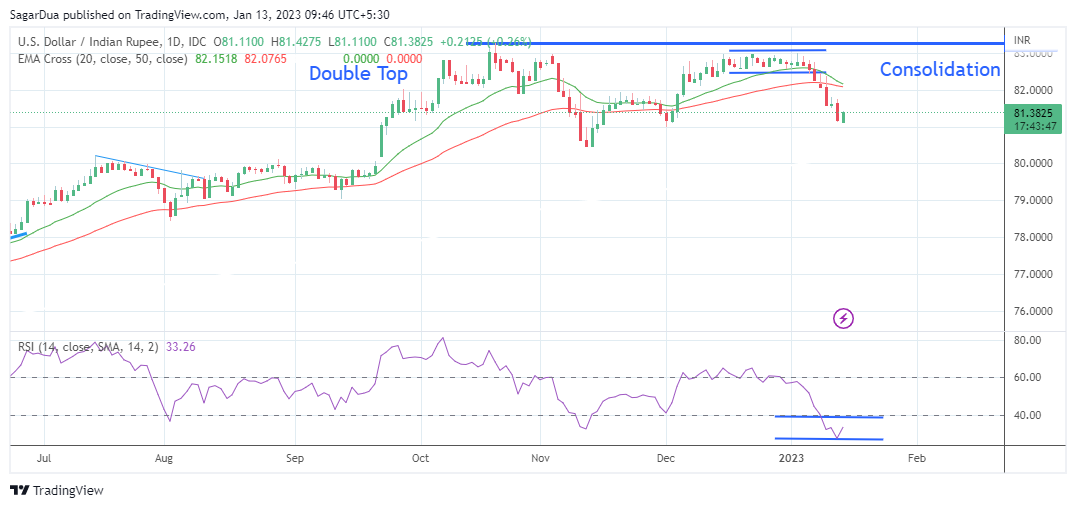
USD/INR has witnessed a sell-off after a breakdown of the consolidation formed in a range of 82.56-82.96 on a daily scale. On a broader note, the formation of the Double Top chart pattern around 83.29 triggered a bearish reversal.
The 20-and 50-period Exponential Moving Averages (EMAs) are on the verge of delivering a bear cross around 82.10, which will be added to the downside bias.
Also, the Relative Strength Index (RSI) (14) has shifted into the bearish range of 20.00-40.00, which indicates that the downside momentum is solid.
Going forward, a decisive break below the December low at 81.00 will further drag the asset towards September 23 low at 80.78 followed by November 11 low at 80.48.
On the flip side, a rebound move above November 21 high at around 82.00 will drive the asset toward December 15 low at 82.42. A breach above the latter will expose the asset to reach January high around 83.00.
USD/INR daily chart
Information on these pages contains forward-looking statements that involve risks and uncertainties. Markets and instruments profiled on this page are for informational purposes only and should not in any way come across as a recommendation to buy or sell in these assets. You should do your own thorough research before making any investment decisions. FXStreet does not in any way guarantee that this information is free from mistakes, errors, or material misstatements. It also does not guarantee that this information is of a timely nature. Investing in Open Markets involves a great deal of risk, including the loss of all or a portion of your investment, as well as emotional distress. All risks, losses and costs associated with investing, including total loss of principal, are your responsibility. The views and opinions expressed in this article are those of the authors and do not necessarily reflect the official policy or position of FXStreet nor its advertisers.