USD/CHF taps into 0.9130 in Monday trading
|
- The USD/CHF differential continues to widen as the US Dollar gains strength and the Swiss Franc swoons.
- The SNB's dovish pivot last week continues to drain investor interest in bidding up the CHF.
- The Swiss National Bank held off on further rate hikes last Thursday amidst slumping Swiss inflation data.
The USD/CHF is pinned to the high side in Monday trading, reaching the 0.9130 region. Another move higher will have the pair testing into new five-month highs.
Last week, the Swiss National Bank (SNB) was unceremoniously knocked off its rate hike cycle, surprising markets and flubbing investor expectations when the SNB failed to raise rates another 25 basis points last Thursday.
Inflation figures for the Swiss domestic economy have been unwinding much faster than the SNB initially thought, and the Swiss central bank was forced to pull the plug on its current rate hike schedule.
Central bank tone determining market momentum with rates unmoving
The Greenback (USD) continues to firm up in markets, bolstered by last week's hawkish Federal Reserve (Fed) showing; while both central banks held rates steady last week, it's the Fed that gets the benefit of the doubt in markets, with the US central bank seeing interest rates staying higher for longer than previously forecast.
This week sees a quiet start to things on the economic calendar, with mid-tier data on offering until Thursday's US Gross Domestic Product (GDP) printing.
Tuesday will bring US housing and consumer confidence figures, while CHF traders will want to keep an eye on Wednesday's ZEW sentiment expectations and the SNB's quarterly bulletin.
USD/CHF technical outlook
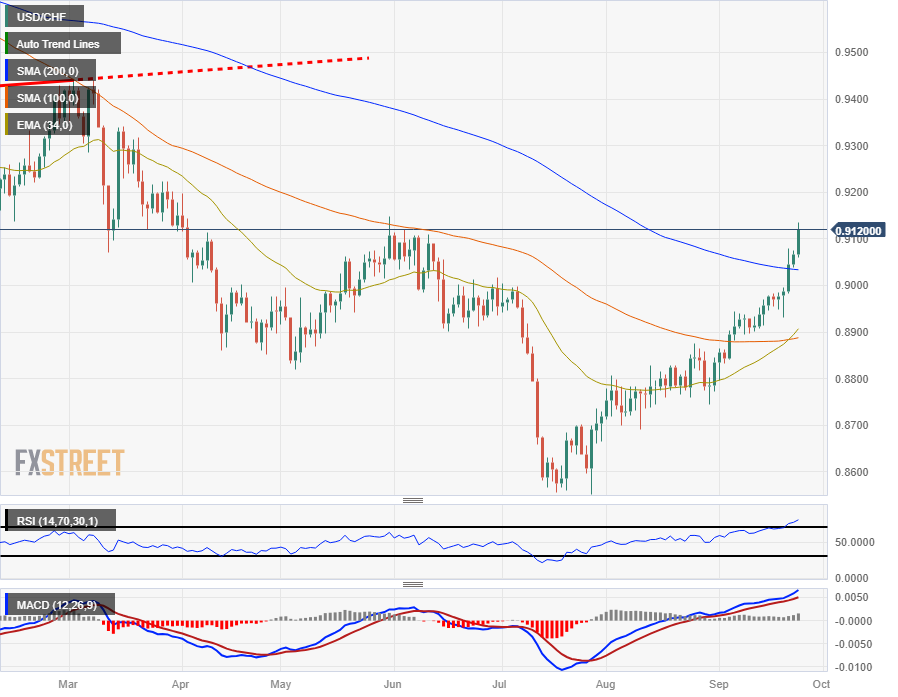
Bullish momentum for the US Dollar is pushing the USD/CHF pair higher, and hourly candles are accelerating into the top end. The pair is up over 2% from last week's low near 0.8930, and a fresh push higher will put the pair into new five-month highs.
Daily candlesticks see the USD/CHF pushing above the 200-day Simple Moving Average (SMA) which currently sits near 0.9050, and the 34-day Exponential Moving Average (EMA) has turned bullish, crossing over the 100-day SMA near 0.8900 and set to give prices technical support.
The next significant resistance zone sits at March's swing highs near the 0.9400 handle.
USD/CHF daily chart

USD/CHF technical levels
Information on these pages contains forward-looking statements that involve risks and uncertainties. Markets and instruments profiled on this page are for informational purposes only and should not in any way come across as a recommendation to buy or sell in these assets. You should do your own thorough research before making any investment decisions. FXStreet does not in any way guarantee that this information is free from mistakes, errors, or material misstatements. It also does not guarantee that this information is of a timely nature. Investing in Open Markets involves a great deal of risk, including the loss of all or a portion of your investment, as well as emotional distress. All risks, losses and costs associated with investing, including total loss of principal, are your responsibility. The views and opinions expressed in this article are those of the authors and do not necessarily reflect the official policy or position of FXStreet nor its advertisers.