USD/CHF Price Analysis: Bounces back strongly from 0.8900 ahead of SNB’s policy
|
- USD/CHF surges to near 0.8930 amid uncertainty over SNB’s policy decision.
- The SNB worries about price pressures reaccelerating due to the weak Swiss Franc.
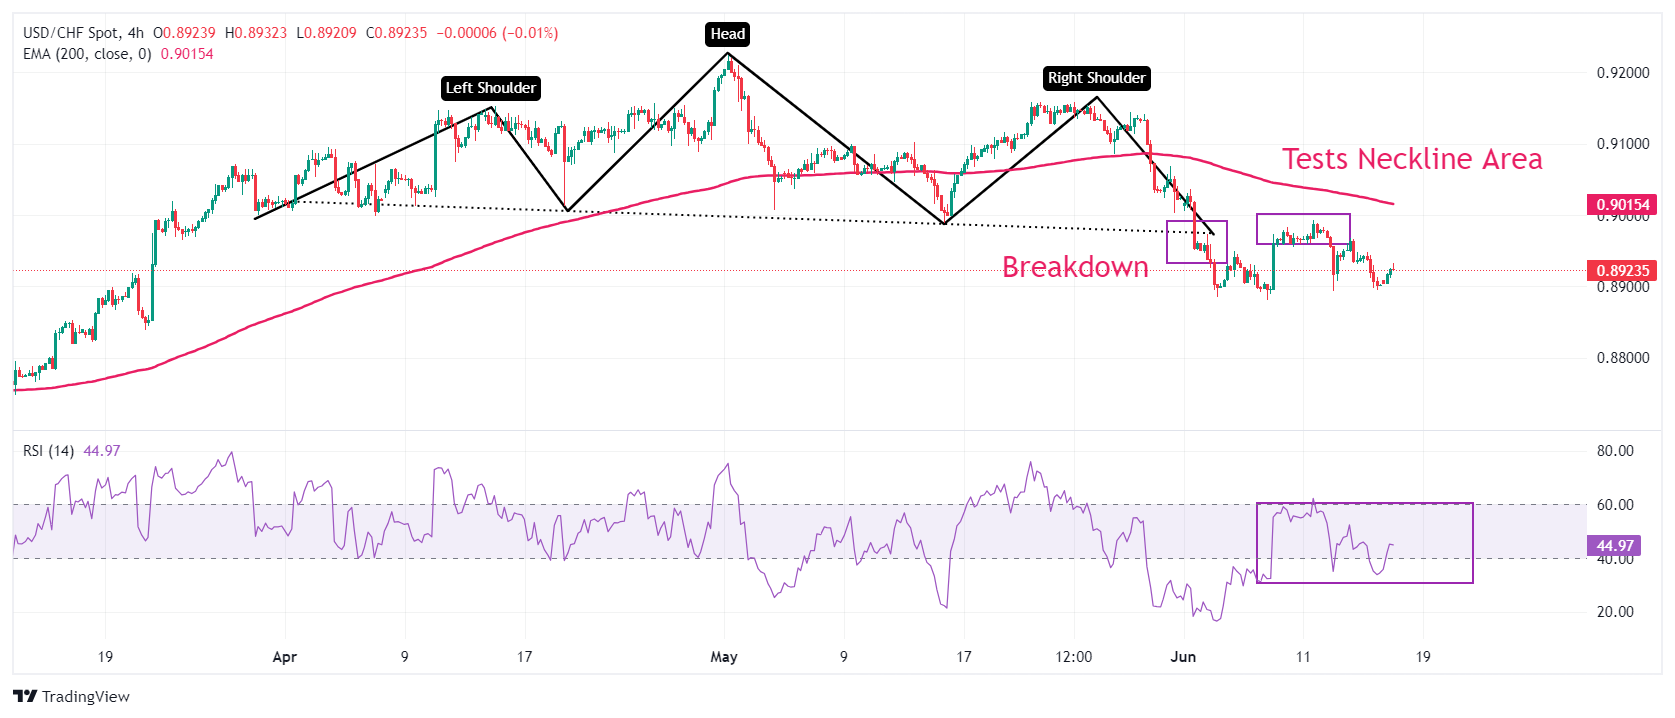
- USD/CHF tests the breakdown region of the H&S pattern.
The USD/CHF pair recovers strongly from the round-level support of 0.8900 and jumps to near 0.8930 in Monday’s early New York session. The Swiss Franc asset strengthens as US Dollar (USD) clings to gains and the uncertainty over the Swiss National Bank’s (SNB) policy outcome.
Market sentiment appears to be cautious as Federal Reserve (Fed) policymakers continue to support only one rate cut this year as they want to see signs of disinflation for months. Contrary to that, the CME FedWatch tool shows the possibility of two rate cuts, which has been prompted by a higher-than-expected decline in the consumer and producer inflation readings for May.
The US Dollar Index (DXY) holds gains near 105.50. 10-year US Treasury yields soar to 4.27%.
Meanwhile, the Swiss Franc declines ahead of the SNB’s policy’s decision on Thursday. Investors see a close call this time as policymakers remain concerned over the inflation outlook. Weak Swiss Franc have made exports competitive and a sharp rise in import costs have deepened fears of price pressures reaccelerating again. However, year-on-year Swiss inflation has remained comfortably below the 2% threshold since June 2023.
USD/CHF declines after facing selling pressure near the neckline of the Head and Shoulder (H&S) chart pattern formed on a four-hour timeframe. A breakdown of the H&S chart formation results in a bearish reversal. The asset has established below the 200-period Exponential Moving Average (EMA) near 0.9015, which indicates that the overall trend is bearish.
The 14-period Relative Strength Index (RSI) hovers near 40.00. A decisive break below the same would trigger a bearish momentum.
Going forward, more recovery above the psychological resistance of 0.9000 will drive the asset towards June 3 high at 0.9036, followed by May 28 low at 0.9086.
On the flip side, room for more downside towards March 21 low at 0.8840 and the round-level support of 0.8800 will open if the asset breaks below June 4 low of 0.8900.
USD/CHF four-hour chart
Information on these pages contains forward-looking statements that involve risks and uncertainties. Markets and instruments profiled on this page are for informational purposes only and should not in any way come across as a recommendation to buy or sell in these assets. You should do your own thorough research before making any investment decisions. FXStreet does not in any way guarantee that this information is free from mistakes, errors, or material misstatements. It also does not guarantee that this information is of a timely nature. Investing in Open Markets involves a great deal of risk, including the loss of all or a portion of your investment, as well as emotional distress. All risks, losses and costs associated with investing, including total loss of principal, are your responsibility. The views and opinions expressed in this article are those of the authors and do not necessarily reflect the official policy or position of FXStreet nor its advertisers.
