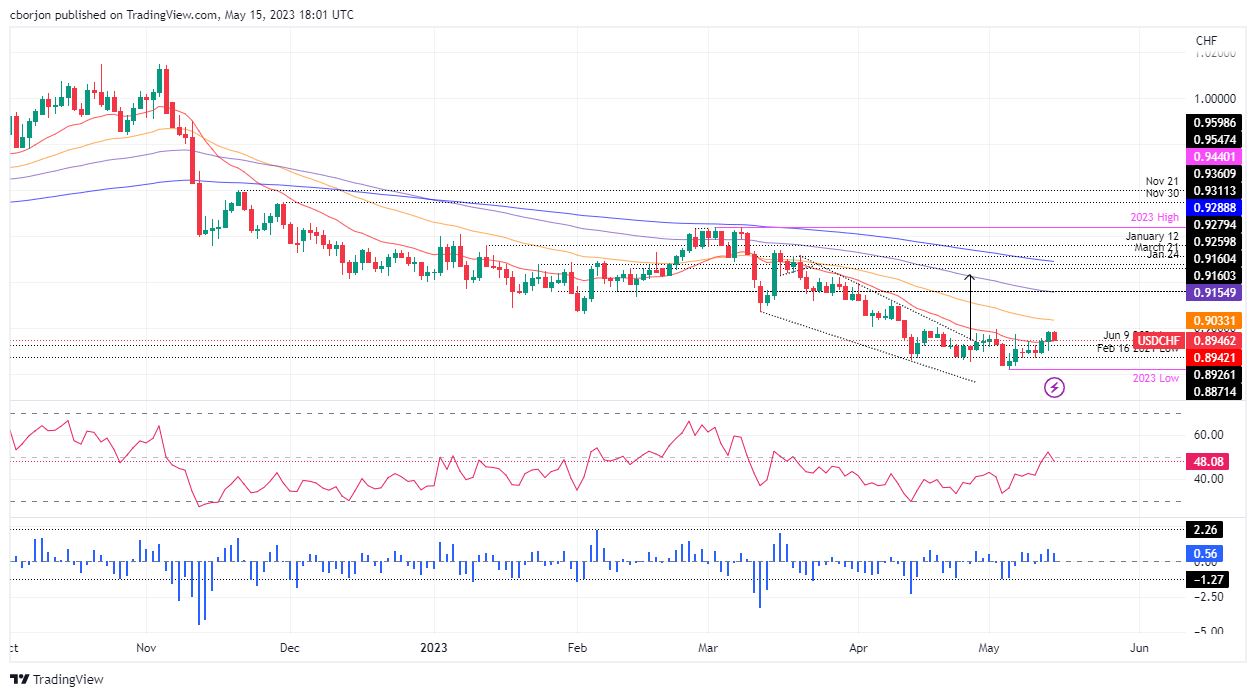
USD/CHF Price Analysis: Stumbles as the CHF gains strength and forms bearish-harami
|
- Swiss Producer and Import Prices for April remain stable at 0.2% MoM, with a 90% chance of a 25 bps rate hike by SNB in June.
- New York Fed’s manufacturing index nosedives, while Fed speakers emphasize high inflation and the need for higher interest rates.
- USD/CHF tests solid support faces downward bias as bearish RSI and 3-day RoC indicators suggest sellers remain in control.
The USD/CHF marched down after hitting a daily high of 0.8987, but US Dollar (USD) bulls’ lack of strength, weak US economic data, and expectations of an aggressive Swiss National Bank (SNB) bolstered the Swiss Franc (CHF). At the time of writing, the USD/CHF is trading at 0.8944, down 0.40%.
Fundamental backdrop
At the beginning of the week, the USD/CHF continued to trend lower, but it’s facing solid support at around the 20-day Exponential Moving Average (EMA). Data in the European session showed that the Producer and Import Prices for April in Switzerland were unchanged at 0.2% MoM, while annually based, ticked lower from 2.1% to 1%. Money market futures odds for a 25 bps rate hike by the SNB are at 90% by the June meeting.
On the US front, the New York Fed announced that its manufacturing index plummeted to -31.3 from the -3.9% contraction expected. Further data showed that the labor market is easing, but prices are rising. Regarding Fed speakers crossing the wires, they reiterated that inflation is high, that there’s some work to do, and that higher interest rates are still working its way through the economy.
USD/CHF Price Analysis: Technical outlook
The USD/CHF is downward biased but testing solid support, which, if it holds, can pave the way for further upside. Nevertheless, the Relative Strength Index (RSI) indicator at 48.19 is in bearish territory, suggesting that sellers remain in charge, while the 3-day Rate of Change (RoC) remains above zero but is about to turn bearish.
If USD/CHF resumes below the 20-day EMA At 0.8942, the next support would be 0.8900. The break below will expose the May 10 daily low of 0.8868 before challenging the YTD low of 0.8879. Conversely, the USD/CHF first resistance would be the 0.9000 figure. A breach of the latter will expose the 50-day EMA At 0.9033, followed by the 100-day EMA at 0.9155.
Information on these pages contains forward-looking statements that involve risks and uncertainties. Markets and instruments profiled on this page are for informational purposes only and should not in any way come across as a recommendation to buy or sell in these assets. You should do your own thorough research before making any investment decisions. FXStreet does not in any way guarantee that this information is free from mistakes, errors, or material misstatements. It also does not guarantee that this information is of a timely nature. Investing in Open Markets involves a great deal of risk, including the loss of all or a portion of your investment, as well as emotional distress. All risks, losses and costs associated with investing, including total loss of principal, are your responsibility. The views and opinions expressed in this article are those of the authors and do not necessarily reflect the official policy or position of FXStreet nor its advertisers.
