USD/CHF Price Analysis: Sellers stepped at the 100-DMA, eyeing to crack 0.9470
|
- The USD/CHF tumbling below the 100-day EMA could pave the way for a re-test of 0.9470.
- In the near term, the USD/CHF is neutral downwards, and once it clears 0.9550, it could open the door toward 0.9500.
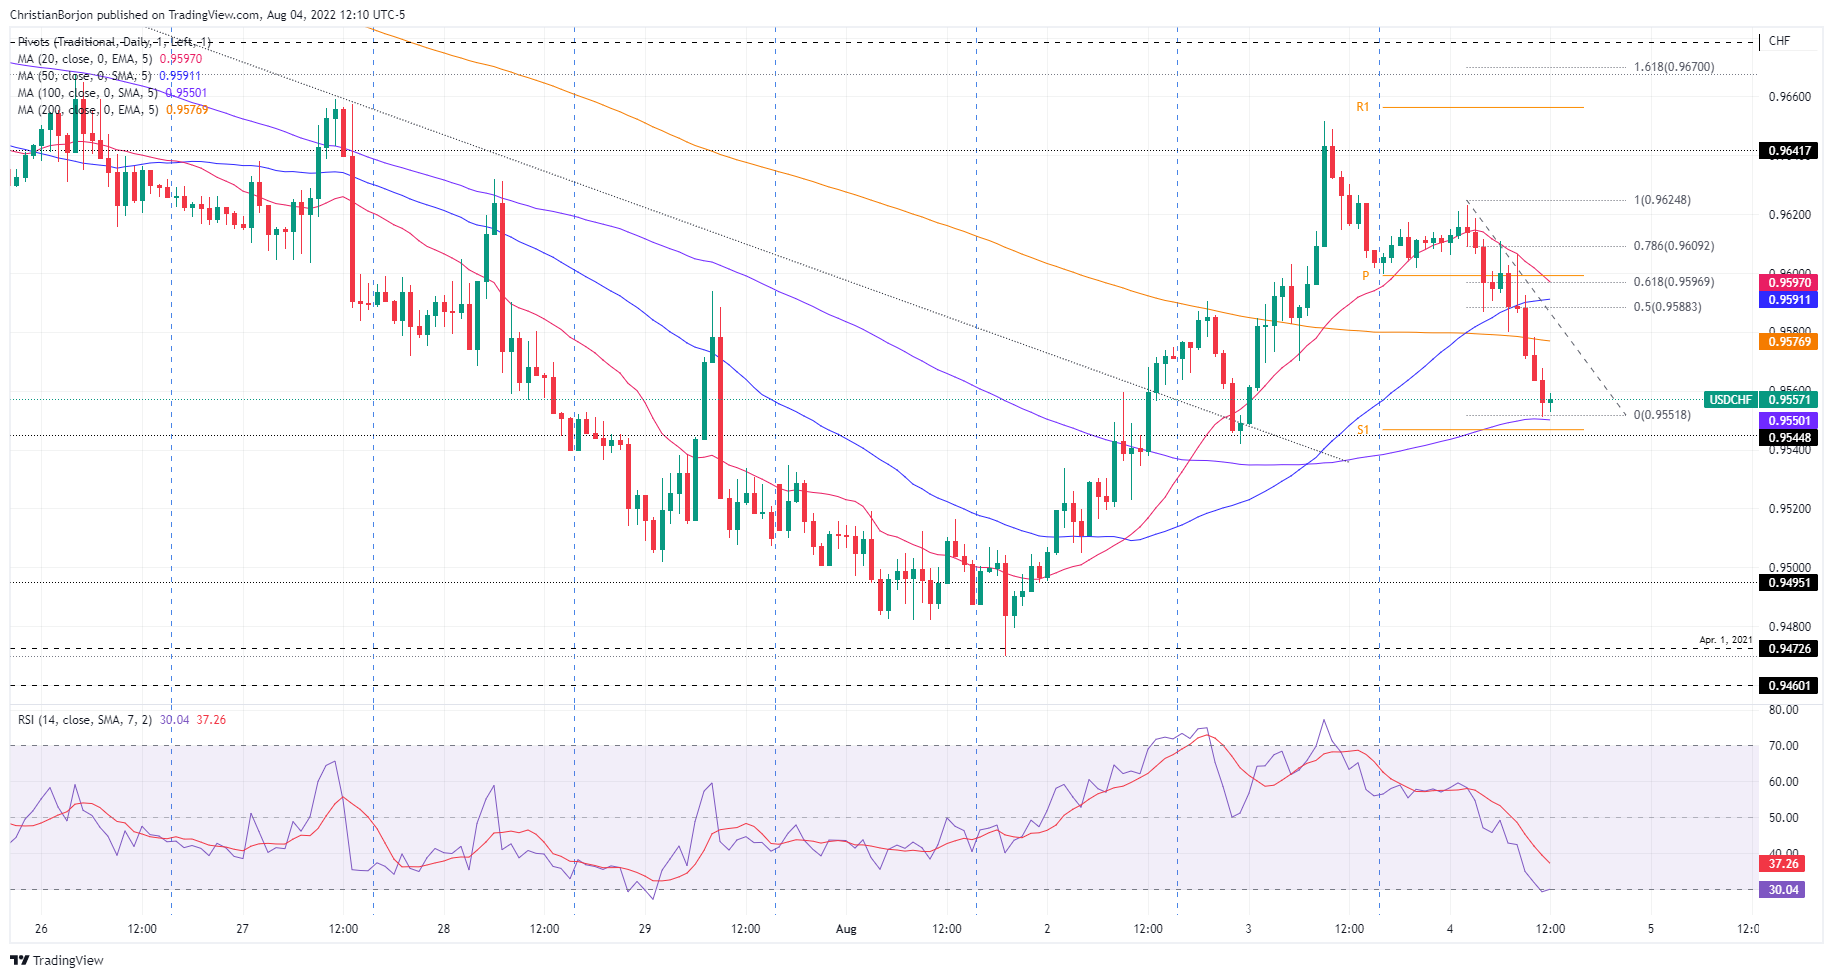
The USD/CHF retraces under the 100-day EMA and shifts the pair’s bias to neutral-downwards as the exchange rate further separates from the previously mentioned moving average (MA) and closes to the August 3 daily low at 0.9542. At the time of writing, the USD/CHF is trading at 0.9655.
USD/CHF Price Analysis: Technical outlook
From a daily chart perspective, the USD/CHF is neutral-to-downward biased reinforced for several reasons. Firstly, the exchange rate is below the 20, 50, and 100-DMAs. Secondly, the Relative Strength Index (RSI) is in negative territory, made a U-turn, from aiming higher, now is headed downwards, narrowing the distance with its 7-day RSI’s MA. Once the RSI crosses under the latter, it confirms the bearish bias.
Therefore, the USD/HF path of least resistance is downwards. The major’s first support would be 0.9542. Once broken, it will expose the 0.9500, followed by the August 2 low at 0.9470.
USD/CHF Hourly chart
The USD/CHF hourly chart illustrates the pair as neutral-to-downward biased. However, the confluence of the S1 daily pivot and the 100-hour EMA around 0.9550 stopped the downtrend at the time of typing. Nevertheless, USD/CHF traders should notice that the Relative Strength Index (RSI) exited from oversold conditions, with its slope aiming higher, so a correction might be on the cards. Therefore, the USD/CHF might aim toward Fibonacci’s 50% retracement at 0.9588 before cracking 0.9550. Once cleared, the major’s next support will be the August 1 daily low at 0.9470.
USD/CHF Key Technical Levels
Information on these pages contains forward-looking statements that involve risks and uncertainties. Markets and instruments profiled on this page are for informational purposes only and should not in any way come across as a recommendation to buy or sell in these assets. You should do your own thorough research before making any investment decisions. FXStreet does not in any way guarantee that this information is free from mistakes, errors, or material misstatements. It also does not guarantee that this information is of a timely nature. Investing in Open Markets involves a great deal of risk, including the loss of all or a portion of your investment, as well as emotional distress. All risks, losses and costs associated with investing, including total loss of principal, are your responsibility. The views and opinions expressed in this article are those of the authors and do not necessarily reflect the official policy or position of FXStreet nor its advertisers.