USD/CHF Price Analysis: Closes to the 50-DMA after reclaiming 0.9250
|
- USD/CHF is subdued but looms around the 50-day EMA, at around 0.9282.
- In the short term, the USD/CHF is range-though slightly tilted upwards, and it might rise to 0.9300.
USD/CHF edges higher above the 20-day Exponential Moving Average (EMA) at 0.9221 and is threatening to register a daily close above Wednesday’s high of 0.9262, cementing a bullish continuation in the USD/CHF. At the time of typing, the USD/CHF is trading at 0.9256 after hitting a daily low of 0.9213.
As the Asian session begins, the USD/CHF daily chart depicts the pair distanced from the 20-day EMA and threatened to break the 50-day Exponential Moving Average (EMA) at 0.9282, though it fell short and retraced. Traders should be aware that the Relative Strength Index (RSI) shifted to bullish territory, but it’s flat, meaning buyers are getting a respite before launching an assault on the 50-day EMA. As an alternate scenario, If the USD/CHF tumbles below the 20-day EMA at 0.9221, that would expose the 0.9200 figure, followed by the current week low of 0.9139.
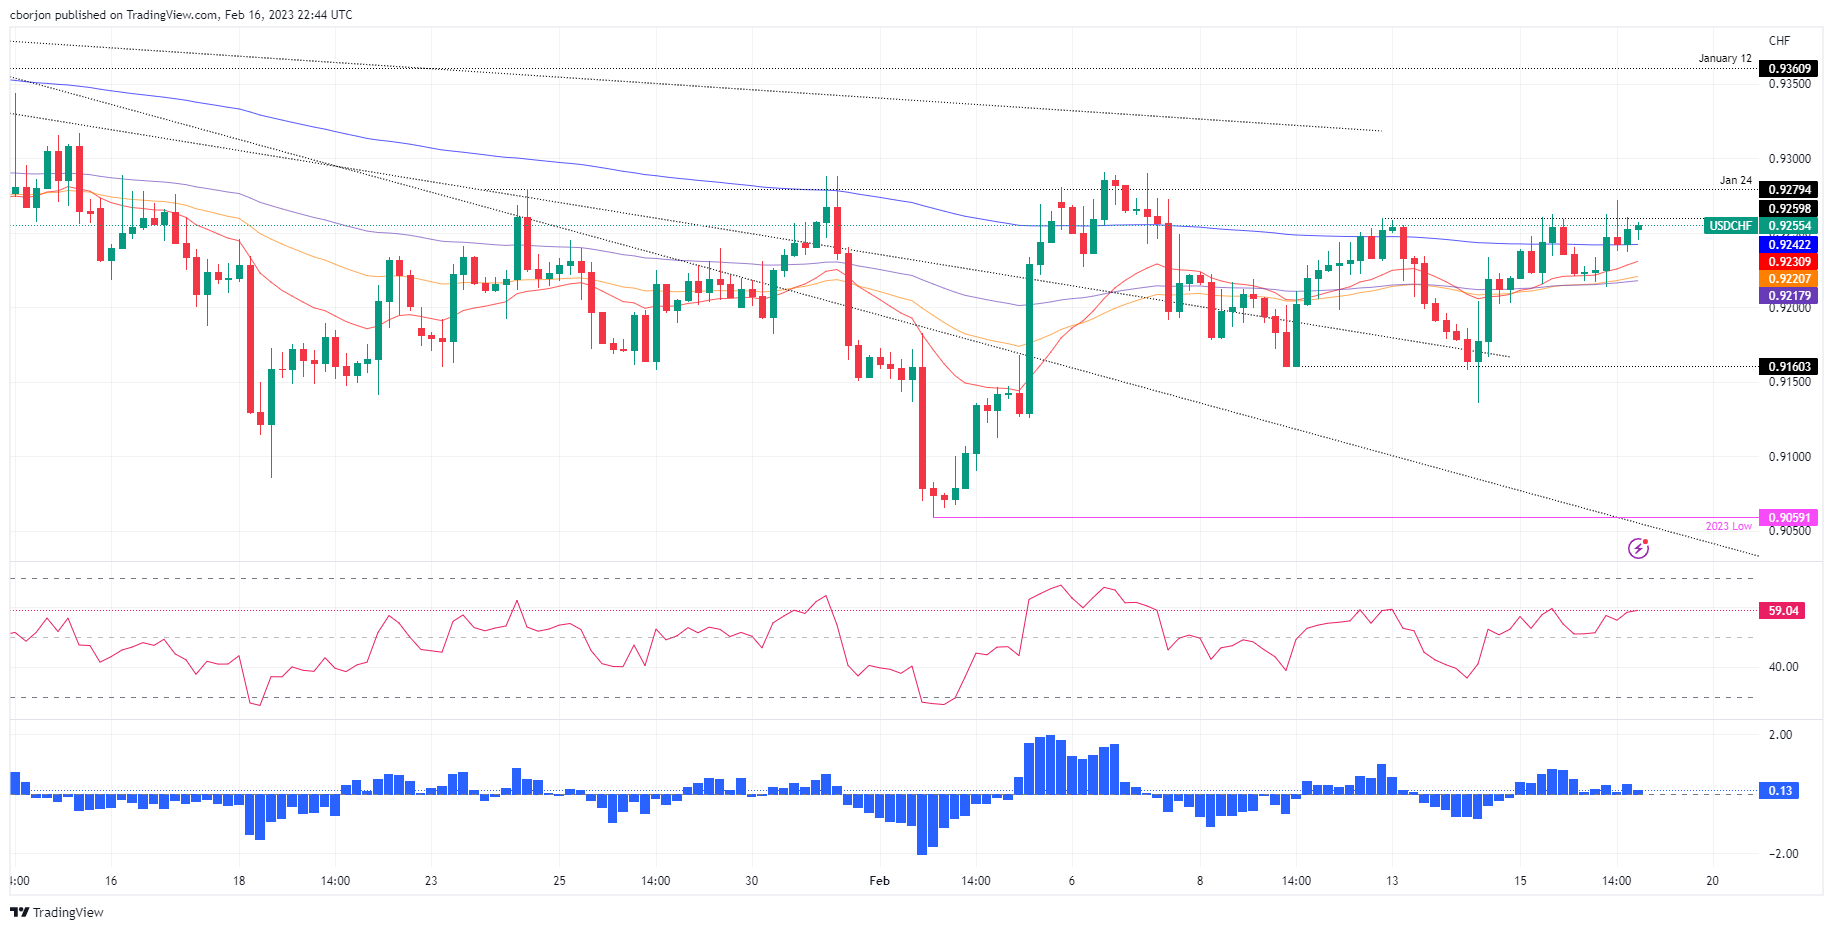
On an intraday time frame, the USD/CHF 4-Hour chart suggests the pair is sideways, within the 0.9160/0.9260 range, but the jump from YTD lows at around 0.9059 opened the door for further upside.
A breach of 0.9260 will expose the 0.9300 figure, which would be up for grabs. A move upward and January 12 at 0.9360 would be the bears’ next line of defense, followed by the psychological 0.9400 mark.
On the downside, sellers need to break below the 200-EMA at 0.9242. Once done, the confluence of the 20/50 EMA around 0.9220/30 would be tested ahead of 0.9200.
USD/CHF 4-Hour chart
USD/CHF Key technical levels
Information on these pages contains forward-looking statements that involve risks and uncertainties. Markets and instruments profiled on this page are for informational purposes only and should not in any way come across as a recommendation to buy or sell in these assets. You should do your own thorough research before making any investment decisions. FXStreet does not in any way guarantee that this information is free from mistakes, errors, or material misstatements. It also does not guarantee that this information is of a timely nature. Investing in Open Markets involves a great deal of risk, including the loss of all or a portion of your investment, as well as emotional distress. All risks, losses and costs associated with investing, including total loss of principal, are your responsibility. The views and opinions expressed in this article are those of the authors and do not necessarily reflect the official policy or position of FXStreet nor its advertisers.
