USD/CHF fails to hold above the 20-day SMA amid weak US PMIs
|
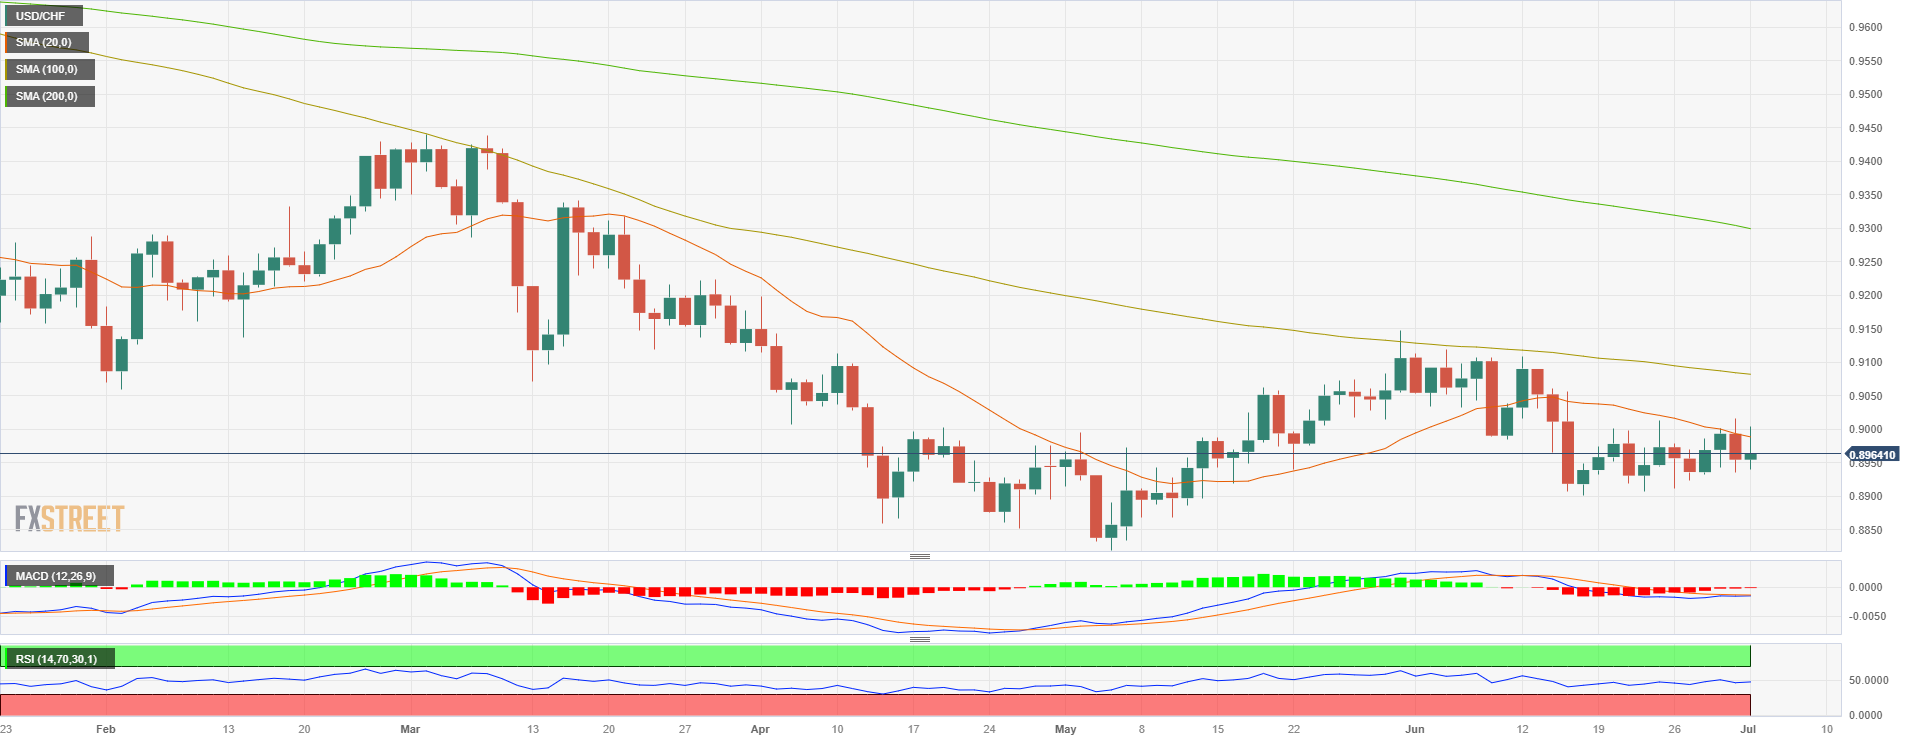
- The USD/CHF rises to a daily high of 0.9000, above the 20-day SMA, then retreats towards the 0.8960 area.
- Soft Swiss inflation figures from June weakened the Swiss Franc during the European session.
- US Manufacturing PMI dropped to 46 in June, weighing on the US Dollar.
At the start of the week, the USD/CHF saw some volatility but remained in positive territory. Soft inflation figures from Switzerland weakened the Swiss Franc leading USD/CHF to rise initially while falling Treasury yields made the USD lose interest following a soft Manufacturing Purchasing Managers Index (PMI) release. The pair remains in positive territory, however, but has erased its daily gains which had seen the pair jump to a high of 0.9000 during the European session.
US yields fall after weak US Manufacturing PMI
The latest release from the Institute for Supply Management's (ISM) Manufacturing Purchasing Managers Index (PMI) for June showed a reading of 46, coming in below the 47.2 expected and the previous figure of 46.9.
Despite US yields retreating across the board, the Federal Reserve’s (Fed) hawkish expectations for July remain steady. According to the CME FedWatch Tool, a 25 basis points (bps) hike at the next meeting on July 31 is almost priced in, while the odds of another 25 bps hike in 2023 have risen to around 40%. In addition, markets await Non-Farm Payroll (NFP) data on Friday, which will continue modelling the expectations for the next Fed decision.
On the other hand, Switzerland's Consumer Price Index (CPI) declined to 1.7% in June, falling from 2.2% in May and falling short of the forecasted 1.8%. This drop brought the Swiss CPI back within the Swiss National Bank's (SNB) target range of 0% to 2%, marking the first time it has been within this range since January 2022. In that sense, dovish bets on the SNB seem to have weakened the CHF, but markets still discount at least one more hike this year.
USD/CHF Levels to watch
According to the daily chart, the technical outlook still favours the CHF despite daily losses. The Relative Strength Index (RSI) and the Moving Average Convergence Divergence (MACD) still hold in negative territory. In addition, the pair trades below the 20, 100 and 200-day Simple Moving Averages (SMA), suggesting that the sellers are in control.
Resistance Levels to watch: 0.8978 (20-day SMA), 0.9000, 0.9050.
Support Levels to watch: 0.8940, 0.8915,0.8900.
USD/CHF Daily chart

Information on these pages contains forward-looking statements that involve risks and uncertainties. Markets and instruments profiled on this page are for informational purposes only and should not in any way come across as a recommendation to buy or sell in these assets. You should do your own thorough research before making any investment decisions. FXStreet does not in any way guarantee that this information is free from mistakes, errors, or material misstatements. It also does not guarantee that this information is of a timely nature. Investing in Open Markets involves a great deal of risk, including the loss of all or a portion of your investment, as well as emotional distress. All risks, losses and costs associated with investing, including total loss of principal, are your responsibility. The views and opinions expressed in this article are those of the authors and do not necessarily reflect the official policy or position of FXStreet nor its advertisers.