USD/CAD Price Analysis: Tuesday’s Doji candlestick renews bullish bias above 1.3300
|
- USD/CAD remains sidelined after reversing from two-week low.
- Bullish candlestick formation, clear bounce off 1.3270 support confluence lure buyers.
- November 2022 low adds to the downside filters.
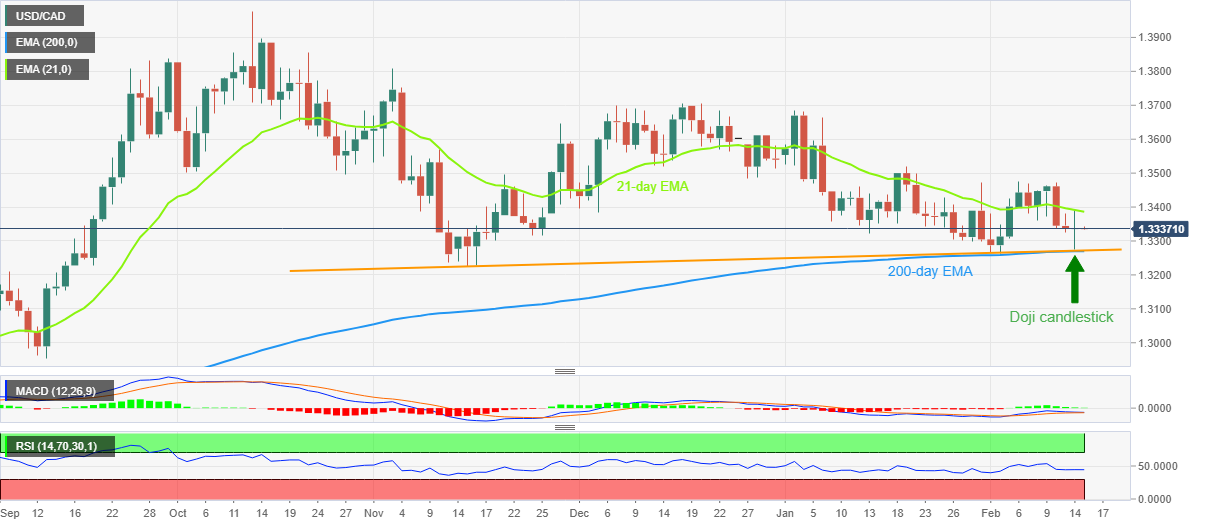
USD/CAD treads water around 1.3330 during early Wednesday, following a volatile day that initially refreshed two-week bottom before bouncing off the 1.3270 support confluence to end the day near 1.3337. In doing so, the Loonie pair portrayed a bullish Doji candlestick on Tuesday.
Not only the candlestick and the recovery from the convergence of the 200-day Exponential Moving Average (EMA) and a three-month-old ascending trend line but steady RSI (14) and a lack of bearish MACD signals also underpin the bullish bias for the USD/CAD pair.
That said, the 21-day EMA level surrounding 1.3385 guards immediate USD/CAD rebound ahead of the 1.3400 round figure and the monthly peak of near 1.3475.
Following that, a run-up towards the January 19 swing high of 1.3520 and then to the previous monthly high near 1.3685 can’t be ruled out.
On the flip side, the aforementioned support confluence challenges the USD/CAD bears around 1.3270, a break of which will need validation from the lows marked in February 2023 and November 2022, respectively near 1.3260 and 1.3225, to convince Loonie pair bears.
Even so, the 1.3200 threshold could act as the last defense of the pair buyers.
Overall, USD/CAD is up for a short-term rebound but the buyers seek validation from the 21-day EMA.
USD/CAD: Daily chart
Trend: Recovery expected
Information on these pages contains forward-looking statements that involve risks and uncertainties. Markets and instruments profiled on this page are for informational purposes only and should not in any way come across as a recommendation to buy or sell in these assets. You should do your own thorough research before making any investment decisions. FXStreet does not in any way guarantee that this information is free from mistakes, errors, or material misstatements. It also does not guarantee that this information is of a timely nature. Investing in Open Markets involves a great deal of risk, including the loss of all or a portion of your investment, as well as emotional distress. All risks, losses and costs associated with investing, including total loss of principal, are your responsibility. The views and opinions expressed in this article are those of the authors and do not necessarily reflect the official policy or position of FXStreet nor its advertisers.