USD/CAD Price Analysis: Surges above the 1.3300 barrier ahead of US ADP Employment Change
|
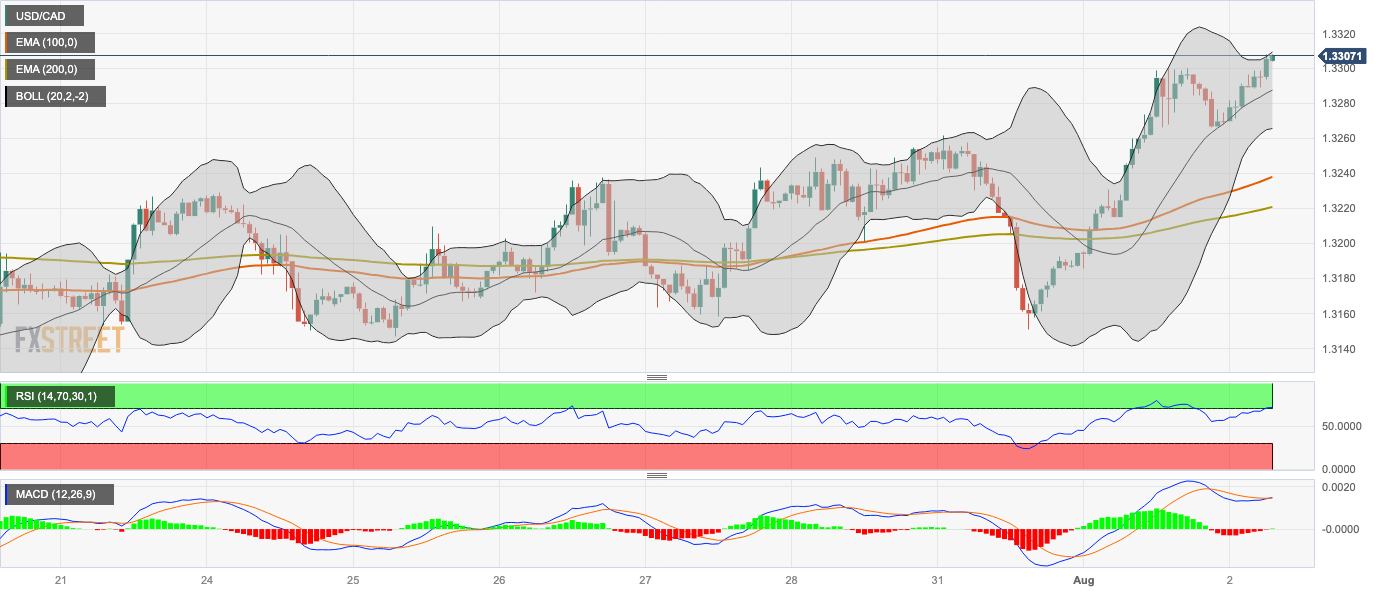
- USD/CAD attracts some dip-buying and edges higher to 1.3305, gaining 0.19% for the day.
- The next barrier for USD/CAD is located at 1.3350; 1.3285 acts as an initial support level.
- The Relative Strength Index (RSI) stands above 50.
The USD/CAD pair gains momentum and surges above the 1.3300 barrier heading into the early European session on Wednesday. The major pair is on track for its sixth weekly close above 1.3200.
Fitch downgraded the US government's credit rating from AAA to AA+, but expectations for an additional 25 basis point (bps) rate hike by the Federal Reserve (Fed) support the US Dollar (USD) and help USD/CAD attract some dip-buying on Wednesday. However, an increase in oil prices would benefit the Canadian Dollar, since Canada is the largest oil exporter to the United States. Market players await the US ADP employment data later in the American session.
According to the four-hour chart, any meaningful follow-through buying above the 1.3300 area will see a rally to the next barrier at 1.3350 (High of June 15). Following that, the July 7 high of 1.3385 will be the next hurdle, followed by 1.3450 (High of June 6).
Looking at the downside, any extended weakness below 1.3285 (the midline of the Bollinger Band) will challenge the next downside filter at 1.3265 (the lower limit of the Bollinger Band) en route to 1.3235 (100-hour EMA) and 1.3220 (the 200-hour EMA). A decisive break below the latter would drive the pair towards 1.3200 (a psychological round mark).
However, the further upside appears favorable as the Relative Strength Index (RSI) stands above 50, activating the bullish momentum for the USD/CAD pair for the time being.
USD/CAD four-hour chart
Information on these pages contains forward-looking statements that involve risks and uncertainties. Markets and instruments profiled on this page are for informational purposes only and should not in any way come across as a recommendation to buy or sell in these assets. You should do your own thorough research before making any investment decisions. FXStreet does not in any way guarantee that this information is free from mistakes, errors, or material misstatements. It also does not guarantee that this information is of a timely nature. Investing in Open Markets involves a great deal of risk, including the loss of all or a portion of your investment, as well as emotional distress. All risks, losses and costs associated with investing, including total loss of principal, are your responsibility. The views and opinions expressed in this article are those of the authors and do not necessarily reflect the official policy or position of FXStreet nor its advertisers.