USD/CAD Price Analysis: Shifts auction below 1.3500 as oil rebounds and USD Index retreats
|
- USD/CAD has slipped sharply below 1.3500 amid a sharp recovery in the oil price upside exhaustion in the USD Index.
- Monthly Canadian Retail Sales data is seen contracting by 1.4% vs. a contraction of 0.2% recorded earlier.
- USD/CAD is auctioning in a Symmetrical Triangle chart pattern, which indicates a volatility contraction.
The USD/CAD pair has dropped below the psychological support of 1.3500 in the early Tokyo session. The Loonie asset has sensed selling pressure as the oil price has rebounded sharply above $72.00 amid optimism over the US borrowing cap raise and the US Dollar Index (DXY) has retreated after a less-confident pullback.
Investors should note that Canada is the leading exporter of oil to the United States and a recovery in the oil price supports the Canadian Dollar.
Going forward, investors will keep an eye on monthly Canadian Retail Sales data (March). Monthly Retail Sales data is seen contracting by 1.4% vs. a contraction of 0.2% recorded earlier. A decline in househoulds’ demand would allow the Bank of Canada (BoC) to keep its interest rate policy steady further.
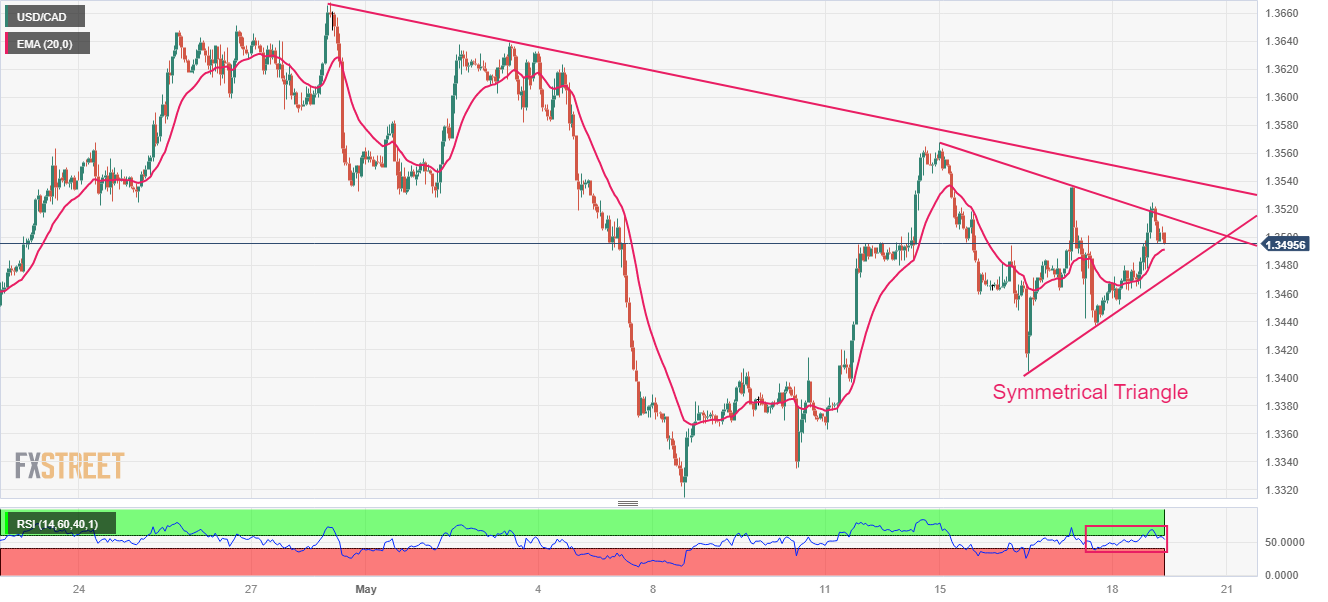
USD/CAD is auctioning in a Symmetrical Triangle chart pattern on an hourly scale, which indicates a volatility contraction. The Loonie asset sensed selling pressure while attempting a breakout of the neutral triangle. The downward-sloping trendline from April 28 high at 1.3668 is acting as a major barricade for the US Dollar bulls.
The 20-period Exponential Moving Average (EMA) at 1.3492 is close to the asset price, indicating a lackluster performance.
Also, the Relative Strength Index (RSI) (14) has slipped back into the 40.00-60.00 range, which signals that investors await a potential trigger for a decisive move.
The upside bias will get strengthened if the Loonie asset manages to surpass the round-level resistance of 1.3600. This will expose the asset to May 21 low at 1.3644 followed by the round-level resistance at 1.3700.
On the flip side, a break below May 18 low at 1.3452 will fade the upside bias and will drag the asset toward April 04 low at 1.3406 and May 08 low at 1.3315.
USD/CAD hourly chart
Information on these pages contains forward-looking statements that involve risks and uncertainties. Markets and instruments profiled on this page are for informational purposes only and should not in any way come across as a recommendation to buy or sell in these assets. You should do your own thorough research before making any investment decisions. FXStreet does not in any way guarantee that this information is free from mistakes, errors, or material misstatements. It also does not guarantee that this information is of a timely nature. Investing in Open Markets involves a great deal of risk, including the loss of all or a portion of your investment, as well as emotional distress. All risks, losses and costs associated with investing, including total loss of principal, are your responsibility. The views and opinions expressed in this article are those of the authors and do not necessarily reflect the official policy or position of FXStreet nor its advertisers.