USD/CAD Price Analysis: Seesaws between 61.8% Fibonacci retracement, 100-day EMA
|
- USD/CAD steps back from 100-day EMA, still positive on a day above the weekly low of 1.3728.
- 200-day EMA offers additional support below 61.8% Fibonacci retracement.
- May 19 low, 50% Fibonacci retracement can challenge the buyers.
USD/CAD drops from the intraday high of 1.3785 to 1.3773 amid the initial hour of Tokyo trading on Friday. In doing so, the pair retreats from 100-day EMA but stays above 61.8% Fibonacci retracement level of February-March upside.
Even so, the bearish MACD and a failure to carry the bounce off 1.3728 favors the sellers.
As a result, odds of the pair’s drop to a 200-day EMA level of 1.3585 become brighter if it breaks the immediate supports surrounding 1.3765 and 1.3730.
On the contrary, an upside clearance of a 100-day EMA level of 1.3780 might not help the bulls regain the throne as May 19 low near 1.3865/70 and 50% Fibonacci retracement level of 1.3940 stand all as near-term key resistances.
USD/CAD daily chart
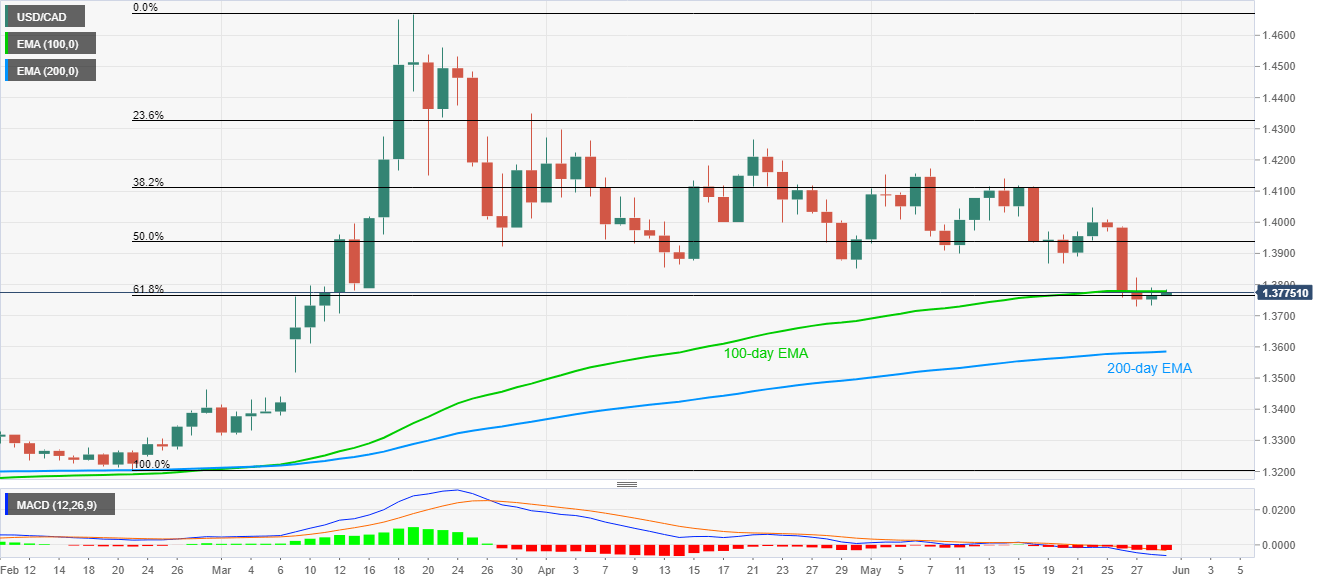
Trend: Bearish
Information on these pages contains forward-looking statements that involve risks and uncertainties. Markets and instruments profiled on this page are for informational purposes only and should not in any way come across as a recommendation to buy or sell in these assets. You should do your own thorough research before making any investment decisions. FXStreet does not in any way guarantee that this information is free from mistakes, errors, or material misstatements. It also does not guarantee that this information is of a timely nature. Investing in Open Markets involves a great deal of risk, including the loss of all or a portion of your investment, as well as emotional distress. All risks, losses and costs associated with investing, including total loss of principal, are your responsibility. The views and opinions expressed in this article are those of the authors and do not necessarily reflect the official policy or position of FXStreet nor its advertisers.