USD/CAD Price Analysis: Recovery prods weekly hurdle around mid-1.3400s
|
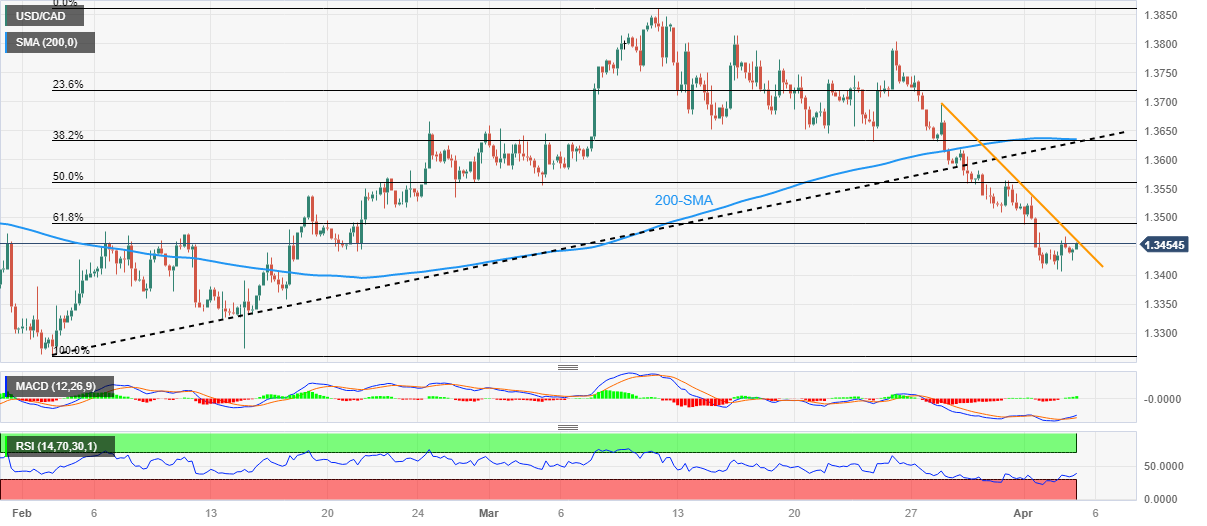
- USD/CAD struggles to extend the previous day’s rebound from seven-week low.
- One-week-old descending resistance line challenge Loonie pair buyers.
- Bullish MACD signals, RSI recovery from oversold territory facilitate upside momentum.
USD/CAD picks up bids to refresh intraday high near 1.3455 as bulls poke a downward-sloping resistance line from the previous Tuesday.
Adding strength to the recovery moves are the bullish MACD signals and the RSI (14) recovery from the oversold territory, which in turn suggests a continuation of the latest rebound.
With this, the Loonie pair buyers are ready to break the immediate hurdle surrounding 1.3460.
Following that, the 61.8% Fibonacci retracement level of February-March upside, near 1.3490 and the 1.3500 round figure could challenge USD/CAD buyers.
In a case where the Loonie pair remains firmer past 1.3500, it can quickly jump to the 50% Fibonacci retracement level of around 1.3560. However, a convergence of the previous support line from early February and the 200-SMA, around 1.3635 at the latest, appears a tough nut to crack for the USD/USD bulls afterward.
On the flip side, the recent low of 1.3405 and the 1.3400 round figure can join the downbeat RSI conditions to challenge the intraday sellers of the USD/CAD pair.
Also acting as the near-term downside filters are the multiple lows marked during early February around 1.3380 and 1.3320.
It’s worth noting that the Year-To-Date low marked in February near 1.3265 acts as the last defense of the USD/CAD buyers
USD/CAD: Four-hour chart
Trend: Further recovery expected
Information on these pages contains forward-looking statements that involve risks and uncertainties. Markets and instruments profiled on this page are for informational purposes only and should not in any way come across as a recommendation to buy or sell in these assets. You should do your own thorough research before making any investment decisions. FXStreet does not in any way guarantee that this information is free from mistakes, errors, or material misstatements. It also does not guarantee that this information is of a timely nature. Investing in Open Markets involves a great deal of risk, including the loss of all or a portion of your investment, as well as emotional distress. All risks, losses and costs associated with investing, including total loss of principal, are your responsibility. The views and opinions expressed in this article are those of the authors and do not necessarily reflect the official policy or position of FXStreet nor its advertisers.