USD/CAD Price Analysis: Rallies above the 1.3200 figure, threatening to clear the YTD high
|
- USD/CAD approaches the YTD high at around 1.3223, amidst a risk-off mood.
- If USD/CAD buyers hold the fort above 1.3200, it could open the door for further gains, as they eye 1.3300.
The USD/CAD conquers the 1.3200 figure for the third time during the year, reaching a fresh weekly high, but shy of the YTD high reached on July 14 at 1.3227. The USD/CAD is trading at 1.3222, above its opening price by 0.39% at the time of writing.
USD/CAD Price Analysis: Technical outlook
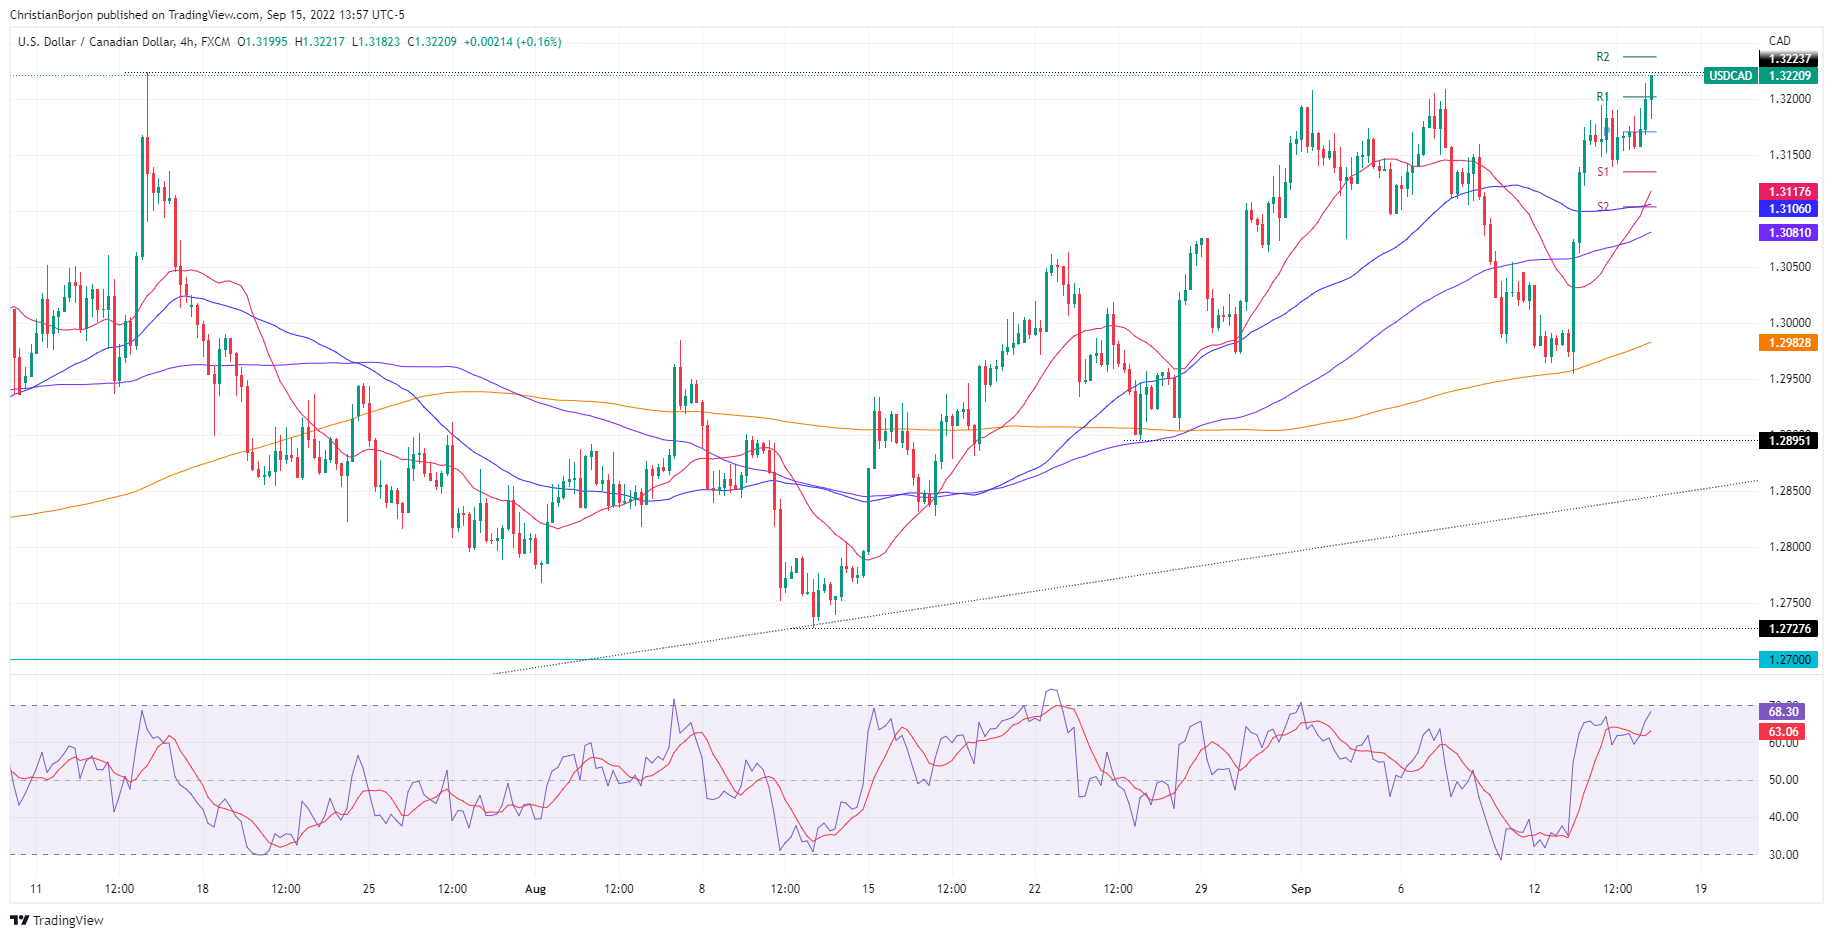
The USD/CAD continued extending its gains throughout the week. After Tuesday’s gains of 1.36%, the major stabilized around the day’s highs, shy of the YTD peak, eyeing a break above that could pave the way towards 1.3300. Worth noting that the Relative Strength Index (RSI) remains in bullish territory, with some room before reaching overbought conditions, suggesting that a 1.3300 test is on the cards.
Near term, the USD/CAD four-hour chart shows the major testing of the 1.3200 figure for the third time in the month, poised to print a fresh YTD high above 1.3220. If buyers clear the 1.3227 YTD high, a move towards 1.3300 is likely to happen, but firstly it would need to overcome some hurdles on its way up.
The USD/CAD first resistance would be the YTD high at 1.3227. The break above will expose the R2 pivot point at 1-3237, followed by the R3 daily pivot at 1.3268, ahead of the 1.3300 figure.
On the flip side, the USD/CAD failure to hold above 1.3200 could pave the way for further downside. Therefore, the USD/CAD first support would be the daily pivot at 1.3172. Once it’s cleared, it would expose support levels, like the S1 daily pivot at 1.3134, followed by the 20-EMA at 1.3117, ahead of the S2 pivot at 1.3104.
USD/CAD Key Technical Levels
Information on these pages contains forward-looking statements that involve risks and uncertainties. Markets and instruments profiled on this page are for informational purposes only and should not in any way come across as a recommendation to buy or sell in these assets. You should do your own thorough research before making any investment decisions. FXStreet does not in any way guarantee that this information is free from mistakes, errors, or material misstatements. It also does not guarantee that this information is of a timely nature. Investing in Open Markets involves a great deal of risk, including the loss of all or a portion of your investment, as well as emotional distress. All risks, losses and costs associated with investing, including total loss of principal, are your responsibility. The views and opinions expressed in this article are those of the authors and do not necessarily reflect the official policy or position of FXStreet nor its advertisers.