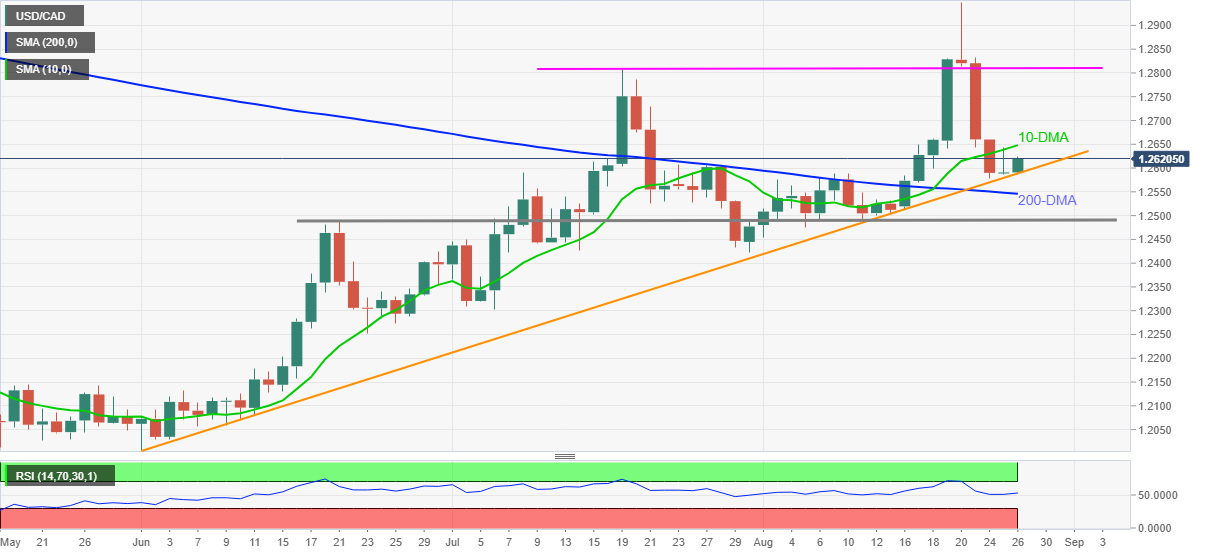
USD/CAD Price Analysis: On the bids above 1.2600, 10-DMA guards immediate upside
|
- USD/CAD refreshing intraday high after bouncing off three-month-old support.
- Firmer RSI directs buyers towards 10-DMA before a bumpy road to yearly high.
- 200-DMA, horizontal line from late June add to the downside filters.
USD/CAD prints the biggest daily gains in a week, up 0.25% intraday around 1.2622 ahead of Thursday’s European session.
Although failures to cross 10-DMA dragged the quote to an ascending support line from June 01, firmer RSI and successful trading beyond 200-DMA, not to forget firmer fundamentals surrounding greenback, keeps the pair buyers hopeful.
Hence, the quote’s another battle with the 10-DMA level of 1.2650 becomes imminent.
However, July 20 lows near the 1.2680 threshold and a five-week-long horizontal resistance line near 1.2810 will challenge the USD/CAD bulls before pleasing them with the monthly low, also the 2021 top, near 1.2950. It’s worth mentioning that the 1.2835-40 area may also contribute towards making the buyer’s reign worrisome.
Alternatively, a daily closing below the stated support line, near 1.2585, will drag the quote to the 200-DMA level of 1.2545.
In a case where the USD/CAD bears keep reins past 1.2545, June high and August 11 low, near 1.2490 will precede July 30 bottom close to 1.2420 to gain the market’s attention.
USD/CAD: Daily chart
Trend: Further upside expected
Information on these pages contains forward-looking statements that involve risks and uncertainties. Markets and instruments profiled on this page are for informational purposes only and should not in any way come across as a recommendation to buy or sell in these assets. You should do your own thorough research before making any investment decisions. FXStreet does not in any way guarantee that this information is free from mistakes, errors, or material misstatements. It also does not guarantee that this information is of a timely nature. Investing in Open Markets involves a great deal of risk, including the loss of all or a portion of your investment, as well as emotional distress. All risks, losses and costs associated with investing, including total loss of principal, are your responsibility. The views and opinions expressed in this article are those of the authors and do not necessarily reflect the official policy or position of FXStreet nor its advertisers.
