USD/CAD Price Analysis: Gives up intraday gains and turns negative as US Dollar retreats
|
- USD/CAD surrenders its entire intraday gains and turns negative as the US Dollar falls back due to firm Fed rate-cut prospects.
- Intraday gains in the US Dollar were driven by an assassination attack on US former President Donald Trump.
- The Canadian Dollar will dance to the tunes of Canada’s inflation data for June.
The USD/CAD pair faces severe selling pressure in an attempt to extend recovery above 1.3660 and turns negative in Monday’s European session. The Loonie asset weakens as the US Dollar (USD) surrenders its gains, which were driven by improved speculation that Donald Trump will win the United States (US) Presidential elections later this year.
The assassination attempt on Donald Trump in Pennsylvania has increased the odds of him having an upper hand on the Joe Biden-led-Democratic Party.
The US Dollar Index (DXY), which tracks the Greenback’s value against six major currencies, retreats from intraday high of 104.32. The USD Index has dropped to near monthly low around 104.00 and is expected to see more weakens as investors see growing speculation for the Federal Reserve (Fed) to begin reducing interest rates from the September meeting as a done deal.
Meanwhile, the Canadian Dollar (CAD) exhibits strength against the US Dollar with a focus on Canada’s Consumer Price Index (CPI) report for June, which will be published on Tuesday. Canada’s month-on-month headline CPI is estimated to have grown at a slower pace of 0.1% from May’s reading of 0.6%.
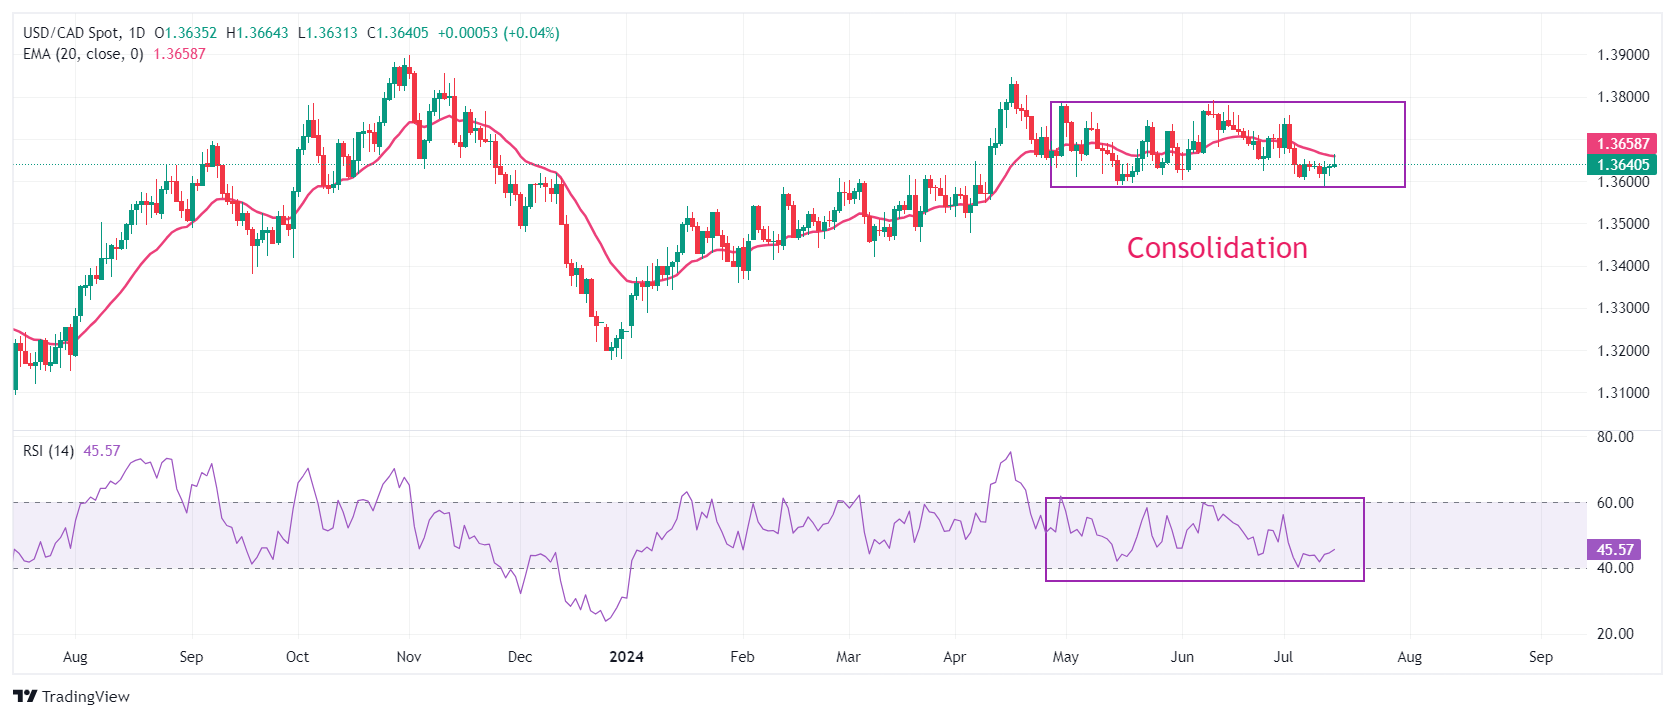
USD/CAD demonstrates a sheer volatility contraction, trading in a limited range of 1.3600-1.3780 from more than two months. A volatility contraction suggests lower volume and small ticks, while a breakout in the same results in wider ticks and heavy volume.
The asset trades below the 20-day Exponential Moving Average (EMA) near 1.3663, suggesting that the near-term outlook is bearish.
The 14-period Relative Strength Index (RSI) oscillates inside the 40.00-60.00 range, indicating indecisiveness among market participants.
Going forward, a decisive breakdown below May 3 low around 1.3600 will expose the asset to April 9 low around 1.3547 and the psychological support of 1.3500.
On the flip side, a fresh buying opportunity would emerge if the asset breaks above June 11 high near 1.3800. This would drive the asset towards April 17 high at 1.3838, followed by 1 November 2023 high at 1.3900.
USD/CAD daily chart
Economic Indicator
Consumer Price Index (MoM)
The Consumer Price Index (CPI), released by Statistics Canada on a monthly basis, represents changes in prices for Canadian consumers by comparing the cost of a fixed basket of goods and services. The MoM figure compares the prices of goods in the reference month to the previous month. Generally, a high reading is seen as bullish for the Canadian Dollar (CAD), while a low reading is seen as bearish.
Read more.Next release: Tue Jul 16, 2024 12:30
Frequency: Monthly
Consensus: 0.1%
Previous: 0.6%
Source: Statistics Canada
Information on these pages contains forward-looking statements that involve risks and uncertainties. Markets and instruments profiled on this page are for informational purposes only and should not in any way come across as a recommendation to buy or sell in these assets. You should do your own thorough research before making any investment decisions. FXStreet does not in any way guarantee that this information is free from mistakes, errors, or material misstatements. It also does not guarantee that this information is of a timely nature. Investing in Open Markets involves a great deal of risk, including the loss of all or a portion of your investment, as well as emotional distress. All risks, losses and costs associated with investing, including total loss of principal, are your responsibility. The views and opinions expressed in this article are those of the authors and do not necessarily reflect the official policy or position of FXStreet nor its advertisers.