USD/CAD Price Analysis: Depreciates to near 1.3500 followed by 23.6% Fibonacci
|
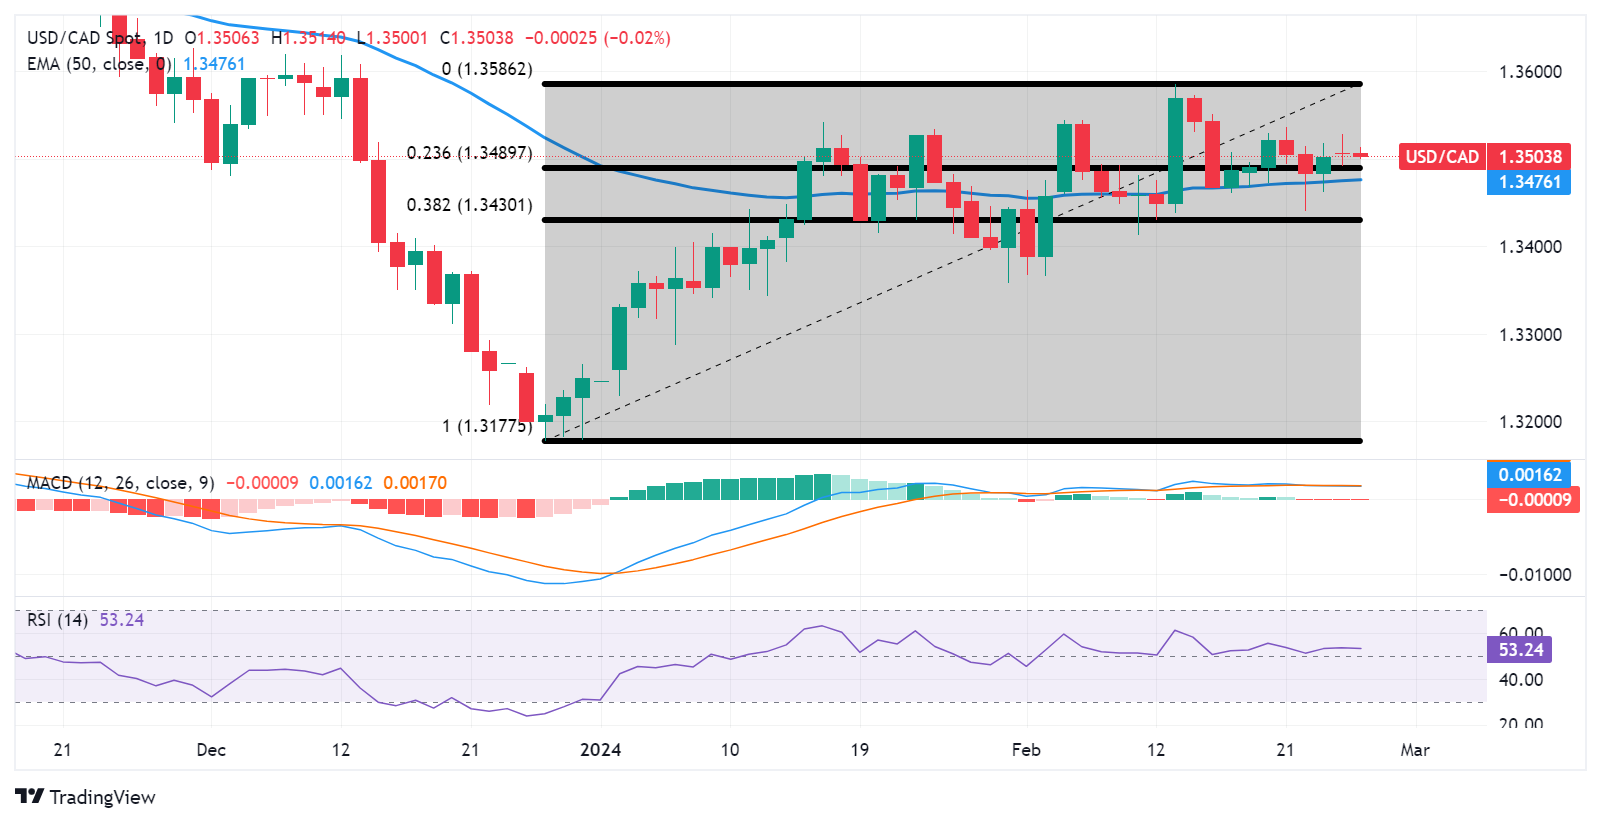
- USD/CAD loses ground to a major level of 1.3500 on Tuesday.
- The immediate support area appears around the 23.6% Fibonacci retracement level at 1.3489 and 50-day EMA at 1.3476.
- The pair could find immediate resistance around the major level of 1.3550 and February’s high at 1.3586.
USD/CAD continues to lose ground on the subdued US Dollar (USD), which could be attributed to the lower US Treasury yields. The USD/CAD pair inches lower to near 1.3500 during the Asian session on Tuesday.
The USD/CAD pair could find the immediate support region around the 23.6% Fibonacci retracement level at 1.3489 and the 50-day Exponential Moving Average (EMA) at 1.3476. A break below the latter could prompt the pair to approach the major level of 1.3450 before the 38.2% Fibonacci retracement level at 1.3430. Further support appears at the psychological support at the 1.3400 level.
The technical analysis of the 14-day Relative Strength Index (RSI) is positioned above 50, suggesting bullish momentum for the USD/CAD pair.
Furthermore, the Moving Average Convergence Divergence (MACD) indicator for the USD/CAD pair, indicates a subdued momentum in the market. This interpretation is based on the MACD line's position above the centerline but lies below the signal line. Traders could await a clearer directional signal from the lagging indicator MACD before making aggressive trades in the pair.
On the upside, the USD/CAD pair could meet the key resistance at the major level of 1.3550 following February’s high at 1.3586. A break above February’s high could exert upward support to lead the pair to explore the region around the psychological resistance level at 1.3600.
USD/CAD: Daily Chart
Information on these pages contains forward-looking statements that involve risks and uncertainties. Markets and instruments profiled on this page are for informational purposes only and should not in any way come across as a recommendation to buy or sell in these assets. You should do your own thorough research before making any investment decisions. FXStreet does not in any way guarantee that this information is free from mistakes, errors, or material misstatements. It also does not guarantee that this information is of a timely nature. Investing in Open Markets involves a great deal of risk, including the loss of all or a portion of your investment, as well as emotional distress. All risks, losses and costs associated with investing, including total loss of principal, are your responsibility. The views and opinions expressed in this article are those of the authors and do not necessarily reflect the official policy or position of FXStreet nor its advertisers.