USD/CAD Price Analysis: Corrects from 1.3800 as US Dollar’s rally stalls ahead of Fed’s decision
|
- USD/CAD trades cautiously ahead of US Inflation and Fed’s policy outcome
- The Fed is expected to leave interest rates unchanged for seventh straight time.
- The BoC could deliver subsequent rate cuts, given weak labor market conditions.
The USD/CAD pair drops to 1.3740 in Wednesday’s European session after failing to recapture the round-level resistance of 1.3800 on Tuesday. The Loonie asset corrects as firm recovery of almost 1.40$ in the US Dollar Index (DXY) appears to be stalling due to uncertainty ahead of the United States (US) Consumer Price Index (CPI) data for May and the Federal Reserve’s (Fed) interest rate decision, which are scheduled in the North American session.
US annual core CPI, which excludes volatile food and energy prices, is estimated to have eased slightly to 3.5% from April’s release of 3.6%, with headline figures growing steadily by 3.4%. The inflation data turning out to be stubborn would weaken market expectations for the Fed to begin reducing interest rates from the September meeting, while soft number would boost them.
Meanwhile, investors will majorly focus on the Fed’s dot plot as the central bank is expected to remain status quo for the seventh straight time.
The Canadian Dollar remains broadly on the backfoot as investors expect that the Bank of Canada (BoC) could deliver subsequent rate cuts to boost labor demand. Canada’s inflation has already declined into BoC’s preferred core CPI range of 1%-3%.
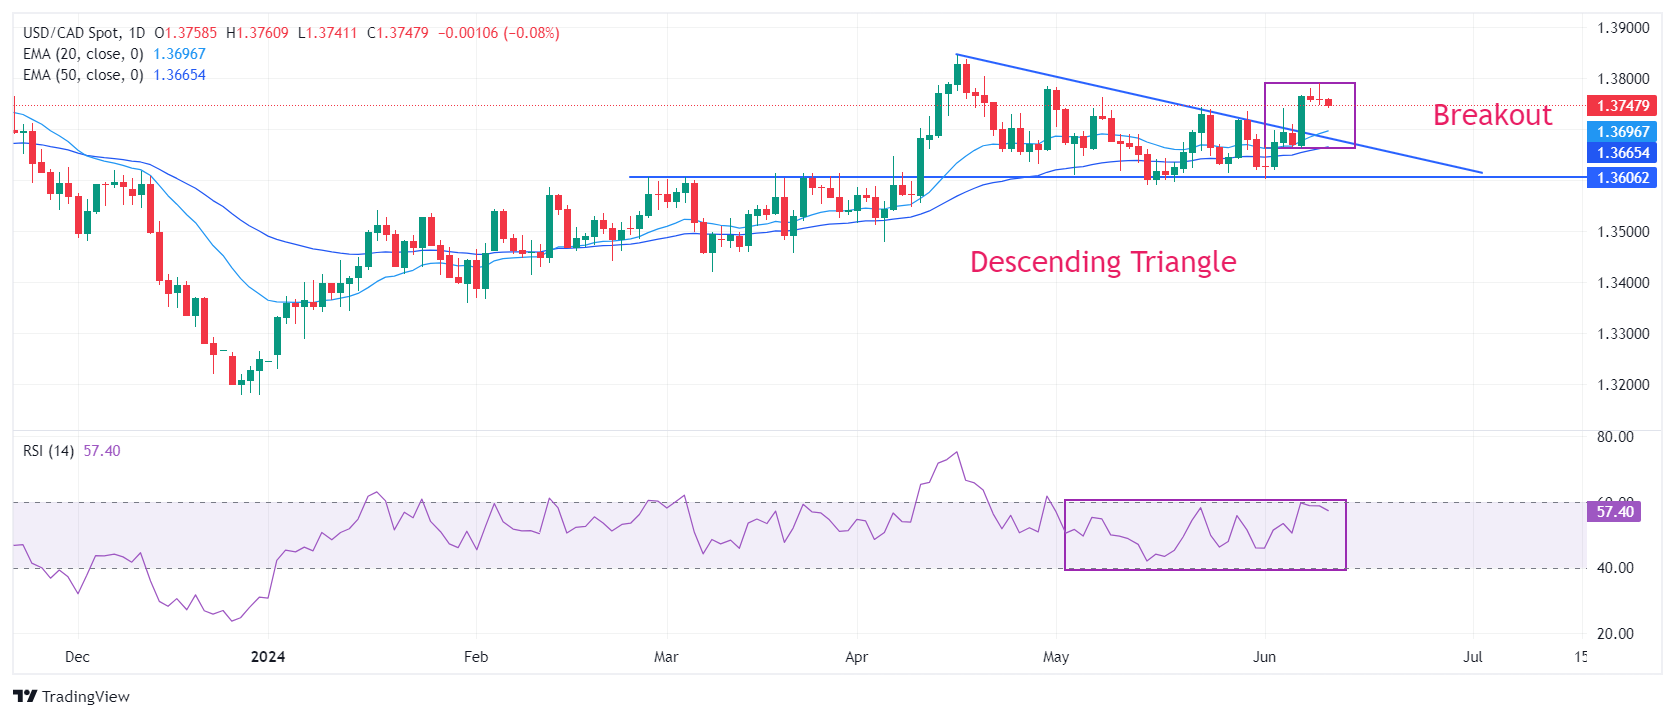
USD/CAD strengthens after a breakout of the Descending Triangle chart pattern formed on a daily timeframe. Upward-sloping 20- and 50-day Exponential Moving Averages (EMAs) near 1.3700 and 1.3660, respectively, suggest that the overall trend is bullish.
The 14-period Relative Strength Index (RSI) hovers near 60.00. A sustainable move above the same will push momentum towards the upside.
Fresh buying opportunity would emerge if the asset breaks above April 17 high at 1.3838. This would drive the asset towards 1 November 2023 high at 1.3900, followed by the psychological resistance of 1.4000.
In an alternate scenario, a breakdown below June 7 low at 1.3663 will expose the asset to May 3 low around 1.3600 and April 9 low around 1.3547.
USD/CAD daily chart
Information on these pages contains forward-looking statements that involve risks and uncertainties. Markets and instruments profiled on this page are for informational purposes only and should not in any way come across as a recommendation to buy or sell in these assets. You should do your own thorough research before making any investment decisions. FXStreet does not in any way guarantee that this information is free from mistakes, errors, or material misstatements. It also does not guarantee that this information is of a timely nature. Investing in Open Markets involves a great deal of risk, including the loss of all or a portion of your investment, as well as emotional distress. All risks, losses and costs associated with investing, including total loss of principal, are your responsibility. The views and opinions expressed in this article are those of the authors and do not necessarily reflect the official policy or position of FXStreet nor its advertisers.