USD/BRL retakes the 20-day SMA after Brazilian inflation data
|
- USD/BRL rose to a high near 4.9680 and then settled at 4.9450.
- Brazilian IPCA from August showed no surprises.
- Markets are cautious, awaiting inflation figures from the US on Wednesday.
The USD/BRL gathered momentum in Tuesday’s session after the BRL decline after the release of the Brazilian inflation figures from August. On the USD side, it is recovering ground after trading soft on Monday while markets seem cautious ahead of Wednesday’s inflation readings from the US.
The Instituto Brasileiro de Geografia e Estatistica revealed that the IPCA inflation advanced 0.23% MoM and matched expectations.
Recent upward movements of the pair may be attributed to recent rate cuts by the Bank of Brazil’s Monetary Policy Committee (COPOM), and markets are expecting the bank to cut further the target rate next week by 50 basis points to 12.75% which could exacerbate the downside for the Brazilian currency.
On the other hand, the USD is trading firm against its rivals, driven by a cautious market mood and US Treasury yields remaining high. That being said, Wednesday’s Consumer Price Index (CPI) figures will be crucial for the Greenback’s and bond price dynamics as they will play a big rol in modelling expectations of the next Federal Reserve (Fed) decisions. As for now, a pause in next week’s meeting is practically priced in while there's still a 40% chance of one last interest rate hike in either December or November, according to the World Interest Rate Probabilities tool.
USD/BRL Levels to watch
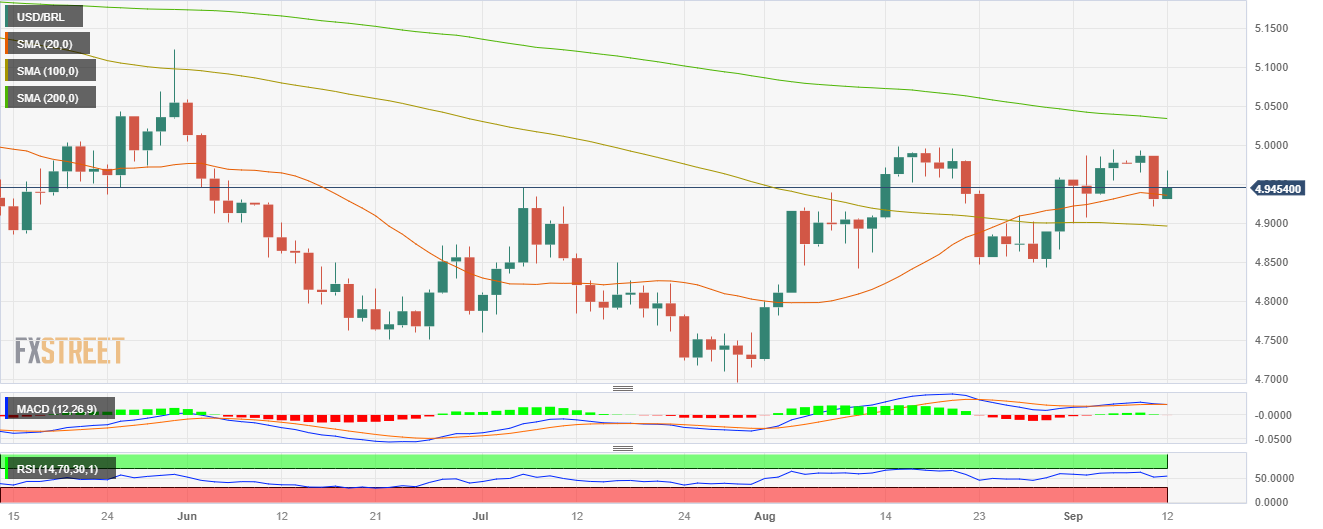
Observing the daily chart, USD/BRL displays a neutral to bullish technical outlook for the short term as the bulls gain momentum. The Relative Strength Index (RSI) demonstrates a favourable upward trend above its midline, while the Moving Average Convergence (MACD) shows stagnant red bars. Additionally, the pair is above the 20 and 100-day Simple Moving Averages (SMAs), but below the 200-day SMA, suggesting that the bulls are in command over the bears on the bigger picture.
Support levels: 4.9350 (20-day SMA), 4.9330, 4.9150.
Resistance levels: 4.9680, 4.9840, 4.9900.
USD/BRL Daily Chart
Information on these pages contains forward-looking statements that involve risks and uncertainties. Markets and instruments profiled on this page are for informational purposes only and should not in any way come across as a recommendation to buy or sell in these assets. You should do your own thorough research before making any investment decisions. FXStreet does not in any way guarantee that this information is free from mistakes, errors, or material misstatements. It also does not guarantee that this information is of a timely nature. Investing in Open Markets involves a great deal of risk, including the loss of all or a portion of your investment, as well as emotional distress. All risks, losses and costs associated with investing, including total loss of principal, are your responsibility. The views and opinions expressed in this article are those of the authors and do not necessarily reflect the official policy or position of FXStreet nor its advertisers.