US Dollar Index Price Analysis: DXY bulls eye 50-day SMA near fresh monthly high
|
- DXY buyers cheer upside break of six-week-old falling trend line, bullish MACD.
- 21-day SMA, a two-week-old rising trend line add to the downside filters.
- December 07 top, early-November lows can lure bulls beyond 50-day SMA.
US dollar index (DXY) stays positive around 90.81 during Monday’s Asian session. In doing so, the greenback gauge extends the upside break of a descending trend line from December 07 towards a fresh high since December 21.
Not only the successful break of previously key resistance line but bullish MACD and sustained bounce off 21-day SMA also favor DXY bulls.
As a result, the quote is up for challenging a 50-day SMA level of 90.96 ahead of teasing the 91.00 round-figure and December 07 top surrounding 91.25.
It should, however, be noted that the US dollar index upside past-91.25 will propel it towards early November lows near 92.15.
On the contrary, a downside break below the previous resistance line, now support, near 90.57, will have to drop beneath an immediate rising support line, at 90.33, as well as a 21-day SMA level of 90.13 before revisiting the 90.00 psychological magnet.
In a case where the greenback sellers dominate below 90.00, the multi-month-low marked during the month around 89.20 should return to the charts.
DXY daily chart
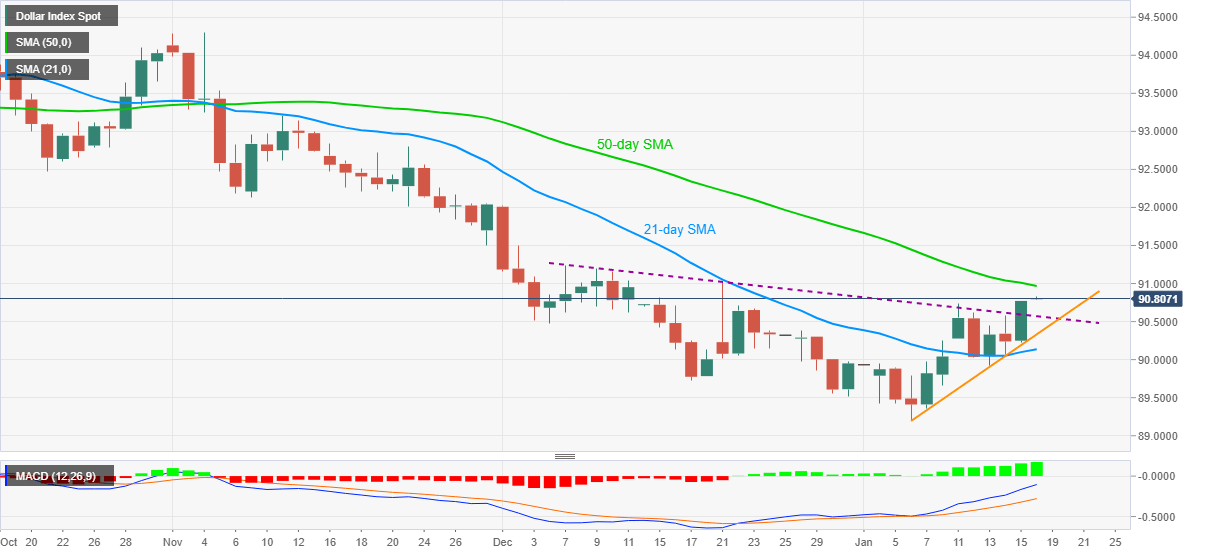
Trend: Further upside expected
Information on these pages contains forward-looking statements that involve risks and uncertainties. Markets and instruments profiled on this page are for informational purposes only and should not in any way come across as a recommendation to buy or sell in these assets. You should do your own thorough research before making any investment decisions. FXStreet does not in any way guarantee that this information is free from mistakes, errors, or material misstatements. It also does not guarantee that this information is of a timely nature. Investing in Open Markets involves a great deal of risk, including the loss of all or a portion of your investment, as well as emotional distress. All risks, losses and costs associated with investing, including total loss of principal, are your responsibility. The views and opinions expressed in this article are those of the authors and do not necessarily reflect the official policy or position of FXStreet nor its advertisers.