SPDR S&P 500 ETF Trust (SPY) News and Forecast: Why is the SPY going down? Is it time to buy?
Premium|
Take advantage of 50% OFF on your first month.
Start your subscription and get access to all our original articles.
You have reached your limit of 5 free articles for this month.
Get all exclusive analysis, access our analysis and get Gold and signals alerts
Elevate your trading Journey.
UPGRADE- SPY falls sharply on Monday as Evergrande concerns expand in Asia.
- Stocks slide also as Fed may talk the taper this week.
- SPY was due for a pullback, but is this a dip to buy?
Well, everyone has been talking about the dip for some time, and the market finally delivered on Monday. A pretty decent fall, but this still only brings us back to levels seen in late July. Even back then people were starting to voice concerns over the record-breaking rally. Morgan Stanley is now turning increasingly bearish, saying that this correction could extend to up to 20%. Corrections can be healthy though, allowing fresh impetus and not letting things get out of control. The backdrop remains solid with equity markets enjoying support from an unprecedented run of central bank stimulus. It is this stimulus that has partly caused the slide with the European Central Bank announcing its own taper with the winding down of its PEPP program – though it is likely to be replaced with another version. The Fed is due on the wires this week, and investors are nervous that the dreaded taper will arrive. Added to these concerns is the evergrowing Evergrande debacle with China looking to see if bond investors blink first. Asian markets started the fall on Monday but have so far steadied on Tuesday.
SPY stock forecast
SPY fell through the 100-day moving average straight from the open, but a decent bounce on the close saw a slightly better overall look. As we can see from the 15-minute chart below, this open resulted in a volume gap from $442 to $437 which can be quickly regained today on any bounce.
-637678138676113142.png)
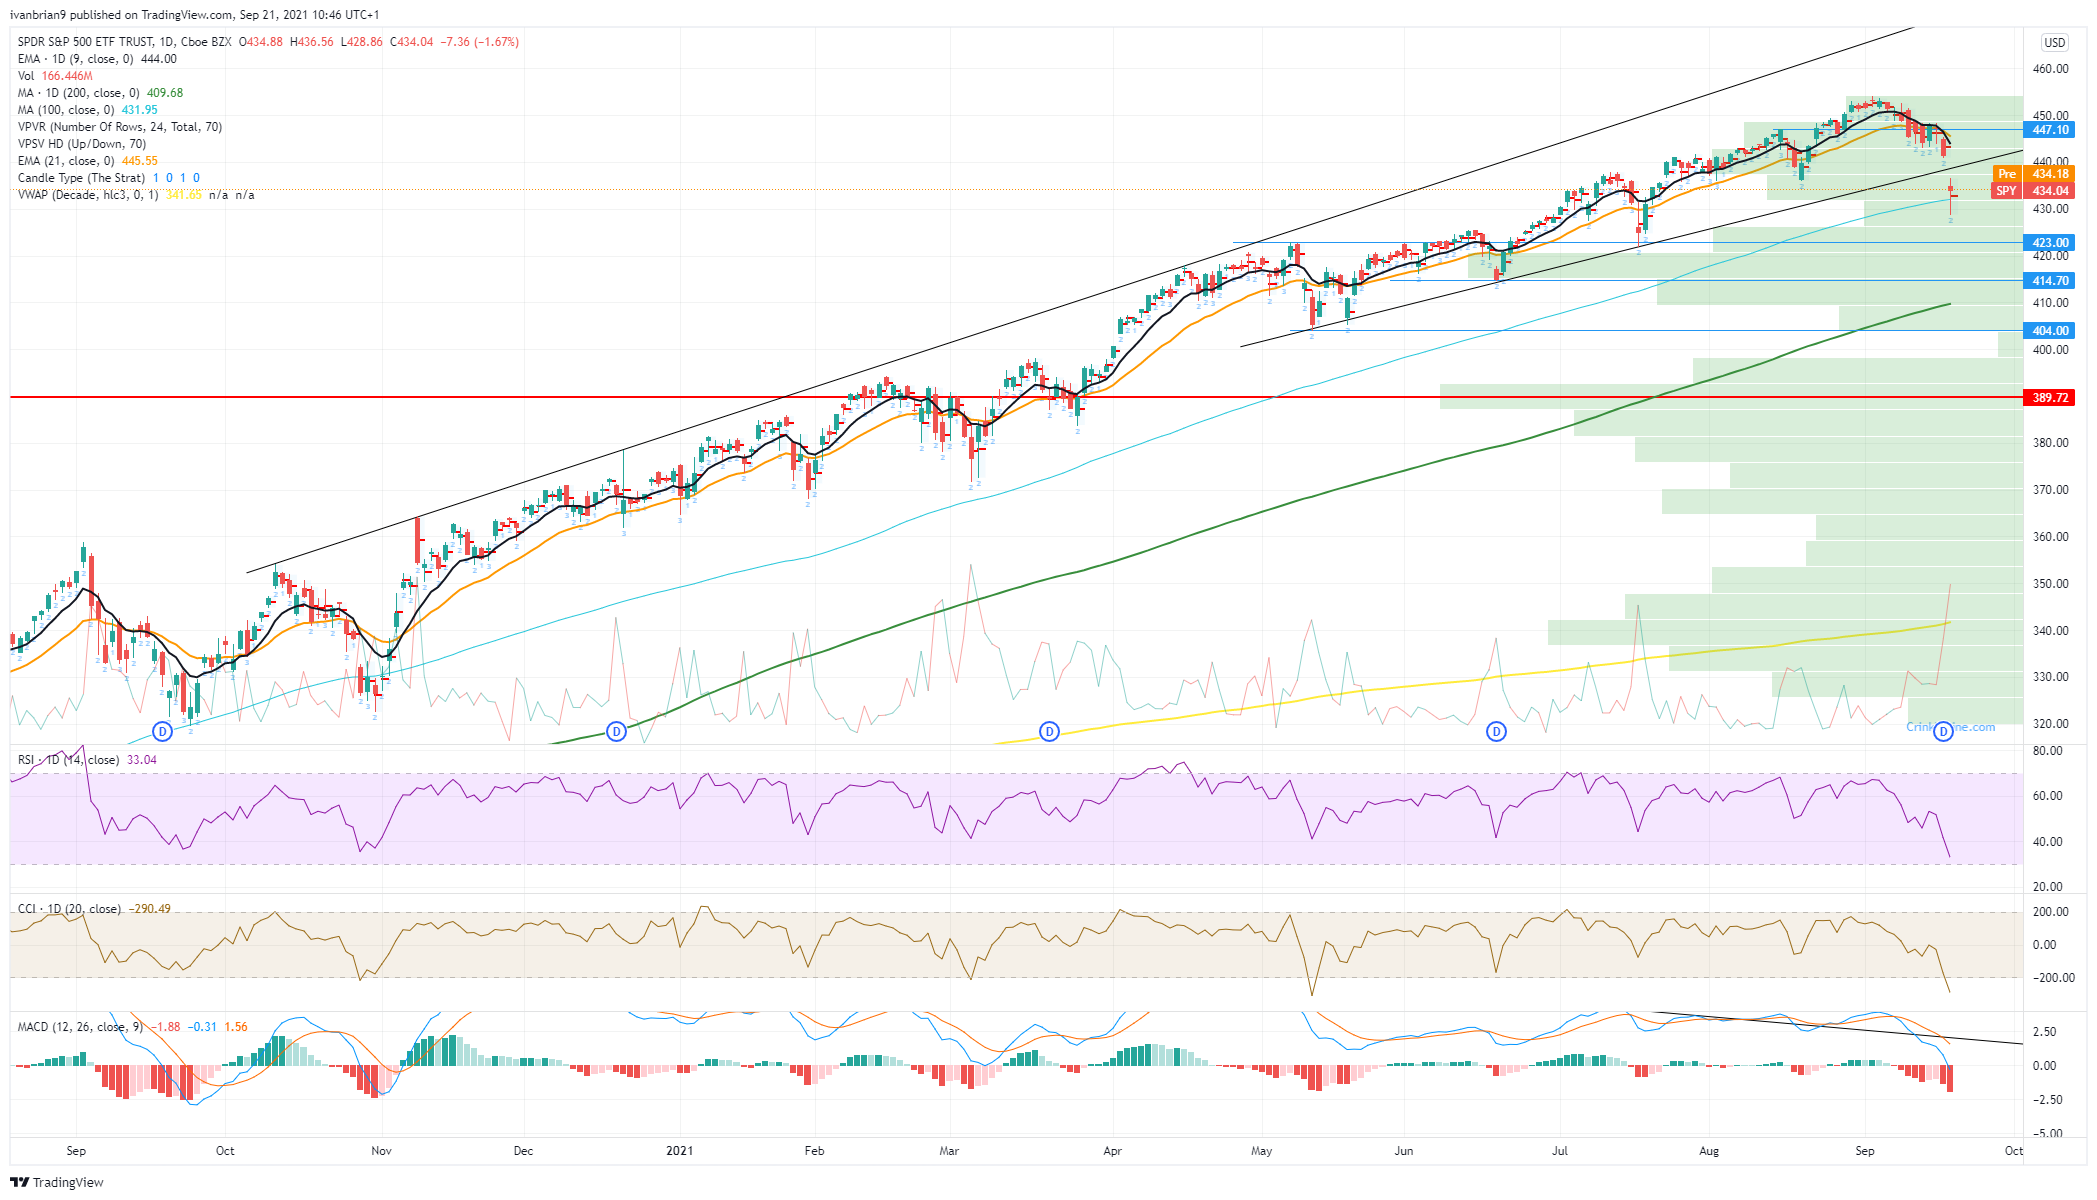
The daily chart shows the extent of the move, with the entirety of Monday's range taking us outside the lower trend line, but the close took us back above the 100-day moving average. We can certainly try to buy the dip here, but clearly resistance is at $441. The short-term trend is bearish with a series of lower highs and lower lows as evidenced by the 9-day moving average. Our preferred buy-the-dip level remains around $420 to $415. Now that quadruple witching is out of the way, markets historically trade lower after this multiple expiration. Also as mentioned September is not a strong month for equities. Added to this is the massive options expiry, which means market makers are likely now hedged long, and so every move lower will result in them selling over hedged positions.
FXStreet View: Bearish, neutral above $441, bullish above $450.
- SPY falls sharply on Monday as Evergrande concerns expand in Asia.
- Stocks slide also as Fed may talk the taper this week.
- SPY was due for a pullback, but is this a dip to buy?
Well, everyone has been talking about the dip for some time, and the market finally delivered on Monday. A pretty decent fall, but this still only brings us back to levels seen in late July. Even back then people were starting to voice concerns over the record-breaking rally. Morgan Stanley is now turning increasingly bearish, saying that this correction could extend to up to 20%. Corrections can be healthy though, allowing fresh impetus and not letting things get out of control. The backdrop remains solid with equity markets enjoying support from an unprecedented run of central bank stimulus. It is this stimulus that has partly caused the slide with the European Central Bank announcing its own taper with the winding down of its PEPP program – though it is likely to be replaced with another version. The Fed is due on the wires this week, and investors are nervous that the dreaded taper will arrive. Added to these concerns is the evergrowing Evergrande debacle with China looking to see if bond investors blink first. Asian markets started the fall on Monday but have so far steadied on Tuesday.
SPY stock forecast
SPY fell through the 100-day moving average straight from the open, but a decent bounce on the close saw a slightly better overall look. As we can see from the 15-minute chart below, this open resulted in a volume gap from $442 to $437 which can be quickly regained today on any bounce.
The daily chart shows the extent of the move, with the entirety of Monday's range taking us outside the lower trend line, but the close took us back above the 100-day moving average. We can certainly try to buy the dip here, but clearly resistance is at $441. The short-term trend is bearish with a series of lower highs and lower lows as evidenced by the 9-day moving average. Our preferred buy-the-dip level remains around $420 to $415. Now that quadruple witching is out of the way, markets historically trade lower after this multiple expiration. Also as mentioned September is not a strong month for equities. Added to this is the massive options expiry, which means market makers are likely now hedged long, and so every move lower will result in them selling over hedged positions.
FXStreet View: Bearish, neutral above $441, bullish above $450.
Information on these pages contains forward-looking statements that involve risks and uncertainties. Markets and instruments profiled on this page are for informational purposes only and should not in any way come across as a recommendation to buy or sell in these assets. You should do your own thorough research before making any investment decisions. FXStreet does not in any way guarantee that this information is free from mistakes, errors, or material misstatements. It also does not guarantee that this information is of a timely nature. Investing in Open Markets involves a great deal of risk, including the loss of all or a portion of your investment, as well as emotional distress. All risks, losses and costs associated with investing, including total loss of principal, are your responsibility. The views and opinions expressed in this article are those of the authors and do not necessarily reflect the official policy or position of FXStreet nor its advertisers.