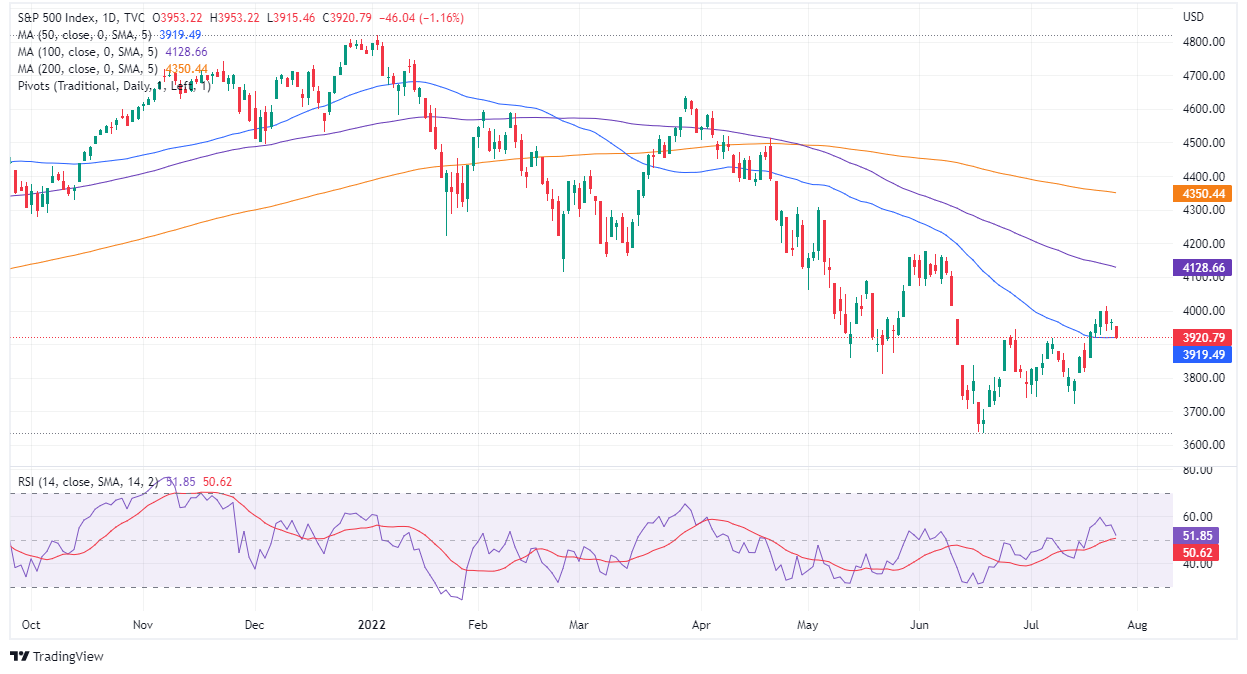
S&P 500 falls towards the 50-DMA as Walmart slashes earnings forecast
|
- The three major US equity indices plunge between 0.44% and 1.79%.
- Sentiment shifted after Walmart blamed “high inflation” as it rips its profit outlook for the second half of 2022.
- The US Dollar Index rises above 107.000, while the US 10-year T-note yield is flat at around 2.79%.
US equities slumped after jumping from YTD low levels, but a dampened market sentiment, alongside July’s Federal Reserve monetary policy decision looming, kept investors uneasy on Tuesday.
At the time of writing, the S&P 500 sits at 3,920.79, falling 1.16%, while the tech-heavy Nasdaq slumps by 1.79%, at 11,572.09, and the Dow Jones Industrial average slides 0.44% to 31,850.33
Sector-wise, the leading sectors are Health, up by 1.02%, followed by Utilities and Real Estate, each recording gains of 0.64 % and 0.25%, respectively. The biggest losers were Consumer Discretionary, Communication Services, and Technology, plummeting 3.09%, 1.88%, and 1.36% each.
Shares fell due to Walmart cutting its earnings forecast, complaining about double-digit food prices and elevated energy prices. Additionally, the US Federal Reserve monetary policy decision is looming, and Europe’s escalating energy crisis re-ignited recession fears amongst traders, which turned to safe-haven assets, namely the greenback.
The US Dollar Index (DXY), a measurement of the greenback’s value against some currencies, rallies 0.62% to 107.132, while the 10-year US Treasury yield is almost flat, yielding 2.792%.
in the commodities complex, WTI drops 1.13%, exchanging hands at $95.60 BPD. Meanwhile, precious metals like gold (XAU/USD) drop 0.11%, trading at $1717.15 a troy ounce.
SP 500 Chart
Key Technical Levels
Information on these pages contains forward-looking statements that involve risks and uncertainties. Markets and instruments profiled on this page are for informational purposes only and should not in any way come across as a recommendation to buy or sell in these assets. You should do your own thorough research before making any investment decisions. FXStreet does not in any way guarantee that this information is free from mistakes, errors, or material misstatements. It also does not guarantee that this information is of a timely nature. Investing in Open Markets involves a great deal of risk, including the loss of all or a portion of your investment, as well as emotional distress. All risks, losses and costs associated with investing, including total loss of principal, are your responsibility. The views and opinions expressed in this article are those of the authors and do not necessarily reflect the official policy or position of FXStreet nor its advertisers.
