Silver Price Prediction: XAG/USD rebounds from multi-month low, not out of the woods yet
|
- Silver reverses an intraday dip to a fresh multi-month low touched earlier this Thursday.
- The technical setup remains tilted in favor of bearish traders and warrants some caution.
- The intraday positive move is more likely to confront stiff resistance near the $27.50 area.
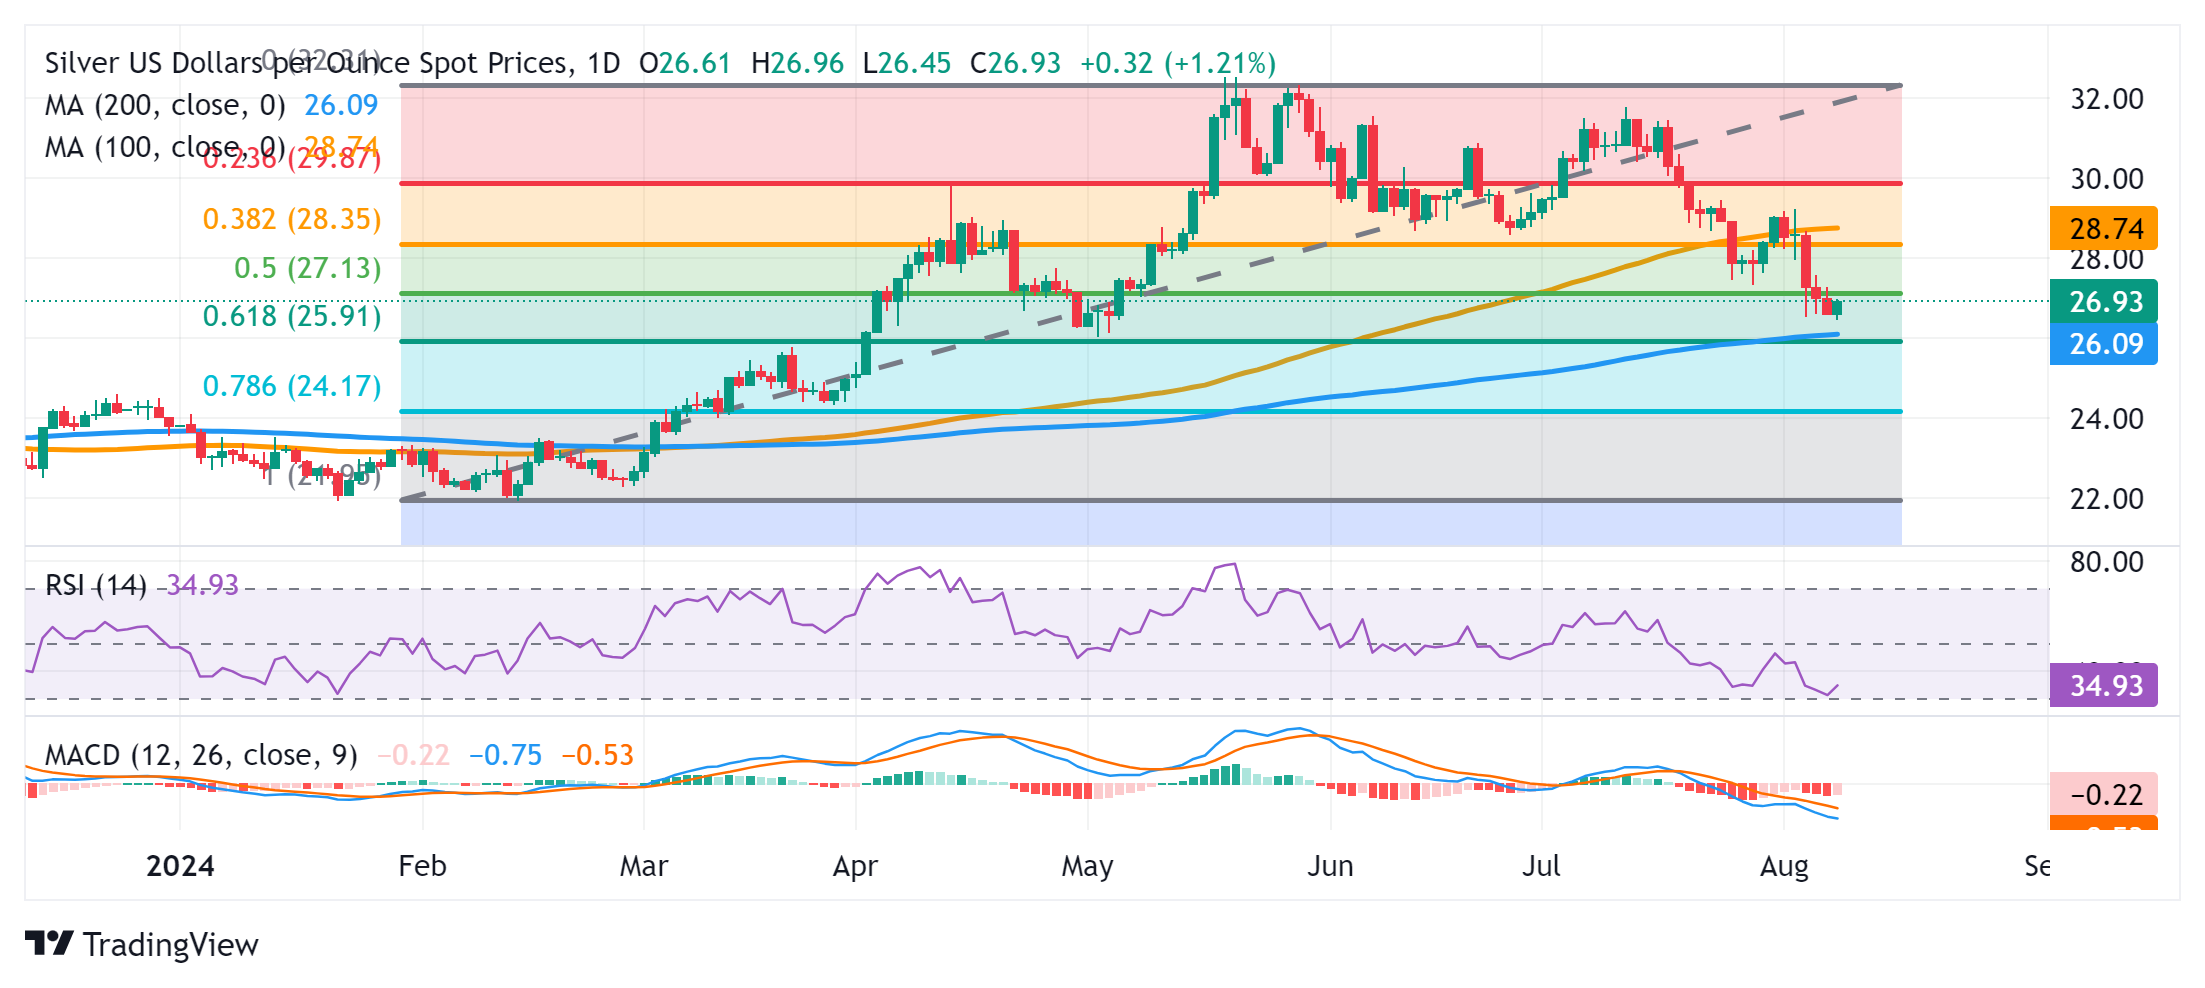
Silver (XAG/USD) stages a goodish recovery from the $26.45 area, or a three-month low touched during the Asian session on Thursday and for now, seems to have snapped a three-day losing streak. The white metal currently trades just below the $27.00 mark, up over 1.20% for the day, though any meaningful appreciating move still seems elusive.
Against the backdrop of the recent breakdown through the 100-day Simple Moving Average (SMA), the overnight close below the 50% Fibonacci retracement level of the February-July positive move could be seen as a fresh trigger for bearish traders. Moreover, technical indicators on the daily chart are holding deep in negative territory and are still away from being in the oversold zone. This, in turn, validates the negative outlook and suggests that the path of least resistance for the XAG/USD is to the downside.
Hence, any subsequent move up is more likely to attract fresh supply near the $27.50 horizontal resistance. A sustained strength beyond, however, might trigger a short-covering rally and lift the XAG/USD beyond the $28.00 mark, to the $28.20 hurdle. The momentum could extend further, though is likely to remain capped near the 100-day SMA support breakpoint, near the $28.70 region. This is followed by the $29.00 round figure, which if cleared will shift the near-term bias back in favor of bullish traders.
On the flip side, the $26.50-$26.45 region, or a multi-month low, now seems to have emerged as an immediate strong support. Bearish traders need to wait for some follow-through selling below the said area before positioning for a further depreciating move to the May monthly swing low, around the $26.00 mark. The next relevant support is pegged near the $25.60 horizontal zone, below which the XAG/USD could fall to the $25.00 psychological mark before eventually dropping to the $24.40-$24.30 support zone.
Silver daily chart
Silver FAQs
Silver is a precious metal highly traded among investors. It has been historically used as a store of value and a medium of exchange. Although less popular than Gold, traders may turn to Silver to diversify their investment portfolio, for its intrinsic value or as a potential hedge during high-inflation periods. Investors can buy physical Silver, in coins or in bars, or trade it through vehicles such as Exchange Traded Funds, which track its price on international markets.
Silver prices can move due to a wide range of factors. Geopolitical instability or fears of a deep recession can make Silver price escalate due to its safe-haven status, although to a lesser extent than Gold's. As a yieldless asset, Silver tends to rise with lower interest rates. Its moves also depend on how the US Dollar (USD) behaves as the asset is priced in dollars (XAG/USD). A strong Dollar tends to keep the price of Silver at bay, whereas a weaker Dollar is likely to propel prices up. Other factors such as investment demand, mining supply – Silver is much more abundant than Gold – and recycling rates can also affect prices.
Silver is widely used in industry, particularly in sectors such as electronics or solar energy, as it has one of the highest electric conductivity of all metals – more than Copper and Gold. A surge in demand can increase prices, while a decline tends to lower them. Dynamics in the US, Chinese and Indian economies can also contribute to price swings: for the US and particularly China, their big industrial sectors use Silver in various processes; in India, consumers’ demand for the precious metal for jewellery also plays a key role in setting prices.
Silver prices tend to follow Gold's moves. When Gold prices rise, Silver typically follows suit, as their status as safe-haven assets is similar. The Gold/Silver ratio, which shows the number of ounces of Silver needed to equal the value of one ounce of Gold, may help to determine the relative valuation between both metals. Some investors may consider a high ratio as an indicator that Silver is undervalued, or Gold is overvalued. On the contrary, a low ratio might suggest that Gold is undervalued relative to Silver.
Information on these pages contains forward-looking statements that involve risks and uncertainties. Markets and instruments profiled on this page are for informational purposes only and should not in any way come across as a recommendation to buy or sell in these assets. You should do your own thorough research before making any investment decisions. FXStreet does not in any way guarantee that this information is free from mistakes, errors, or material misstatements. It also does not guarantee that this information is of a timely nature. Investing in Open Markets involves a great deal of risk, including the loss of all or a portion of your investment, as well as emotional distress. All risks, losses and costs associated with investing, including total loss of principal, are your responsibility. The views and opinions expressed in this article are those of the authors and do not necessarily reflect the official policy or position of FXStreet nor its advertisers.