Silver Price Forecast: XAG/USD manages firm footing above $29 as Fed early rate-cut bets surge
|
- Silver price holds the $29.00 support as investors see the Fed returning to policy-normalization from September.
- US bond yields rebound as Fed officials continue to advocate only one rate cut this year.
- Investors shift focus to preliminary US S&P Global PMIs for June.
Silver price (XAG/USD) continues to hold the crucial support of $29.00 in Wednesday’s early European session. The white metal is consistently seeing buying interest near above-mentioned support amid growing speculation that the Federal Reserve (Fed) will start reducing interest rates from the September meeting.
According to the CME FedWatch tool, 30-day Fed Fund Futures pricing data shows a 67% chance for rate cuts in September, rising from 61.5% as the United States (US) Retail Sales grew at a slower pace than expected in May. The CME FedWatch tool also shows that there will be two rate cuts this year against one signaled by policymakers in their latest interest rate projections report.
Fed officials continue to argue in favor of lowering interest rates only once this year as they want to see inflation declining for months to gain confidence that price pressures are on course to return to the 2% target.
Meanwhile, some recovery in US bond yields due to the Fed’s hawkish narrative has weighed on the Silver price. A recovery move in yields on interest-bearing assets increases the opportunity cost of holding an investment in non-yielding assets, such as Silver.
Going forward, investors will shift focus to preliminary S&P Global PMIs for June, which will be published on Friday.
Silver technical analysis
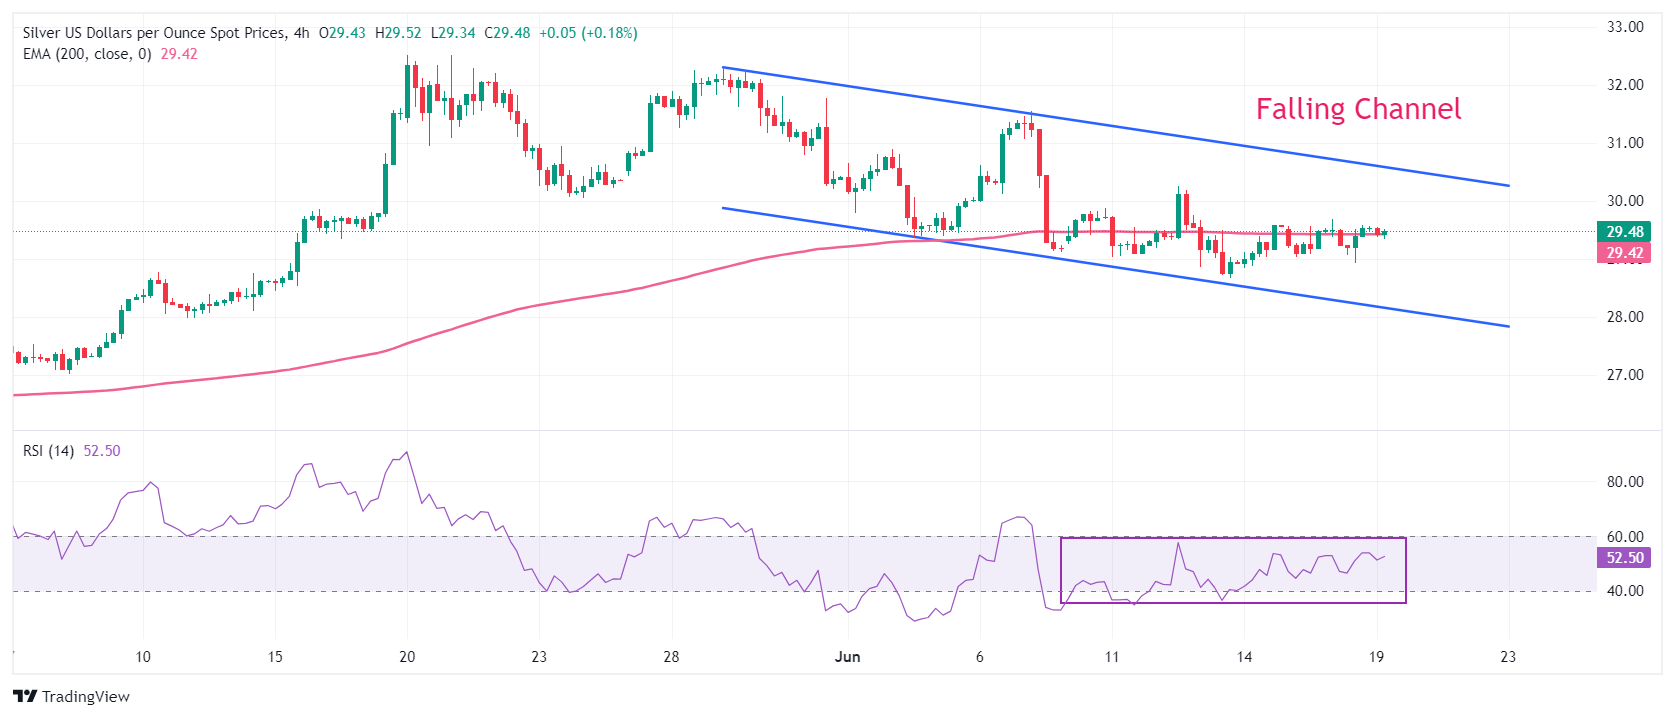
Silver price oscillates in a Falling Channel chart pattern, on a four-hour timeframe, in which each pullback is considered as selling opportunity by market participants. The asset hovers near the 200-period Exponential Moving Average (EMA), which trades around $29.40, indicating indecisiveness among market participants.
The 14-period Relative Strength Index (RSI) oscillates in the 40.00-60.00 range, suggesting a consolidating ahead.
Silver four-hour chart
Information on these pages contains forward-looking statements that involve risks and uncertainties. Markets and instruments profiled on this page are for informational purposes only and should not in any way come across as a recommendation to buy or sell in these assets. You should do your own thorough research before making any investment decisions. FXStreet does not in any way guarantee that this information is free from mistakes, errors, or material misstatements. It also does not guarantee that this information is of a timely nature. Investing in Open Markets involves a great deal of risk, including the loss of all or a portion of your investment, as well as emotional distress. All risks, losses and costs associated with investing, including total loss of principal, are your responsibility. The views and opinions expressed in this article are those of the authors and do not necessarily reflect the official policy or position of FXStreet nor its advertisers.