Silver Price Analysis: XAG/USD strengthens and rallies past $19.00
|
- Silver prices extend recovery to reach levels beyond $19.00.
- The US dollar dives on Fed easing speculation.
- XAG/USD is now at a key resistance area of $19.30.
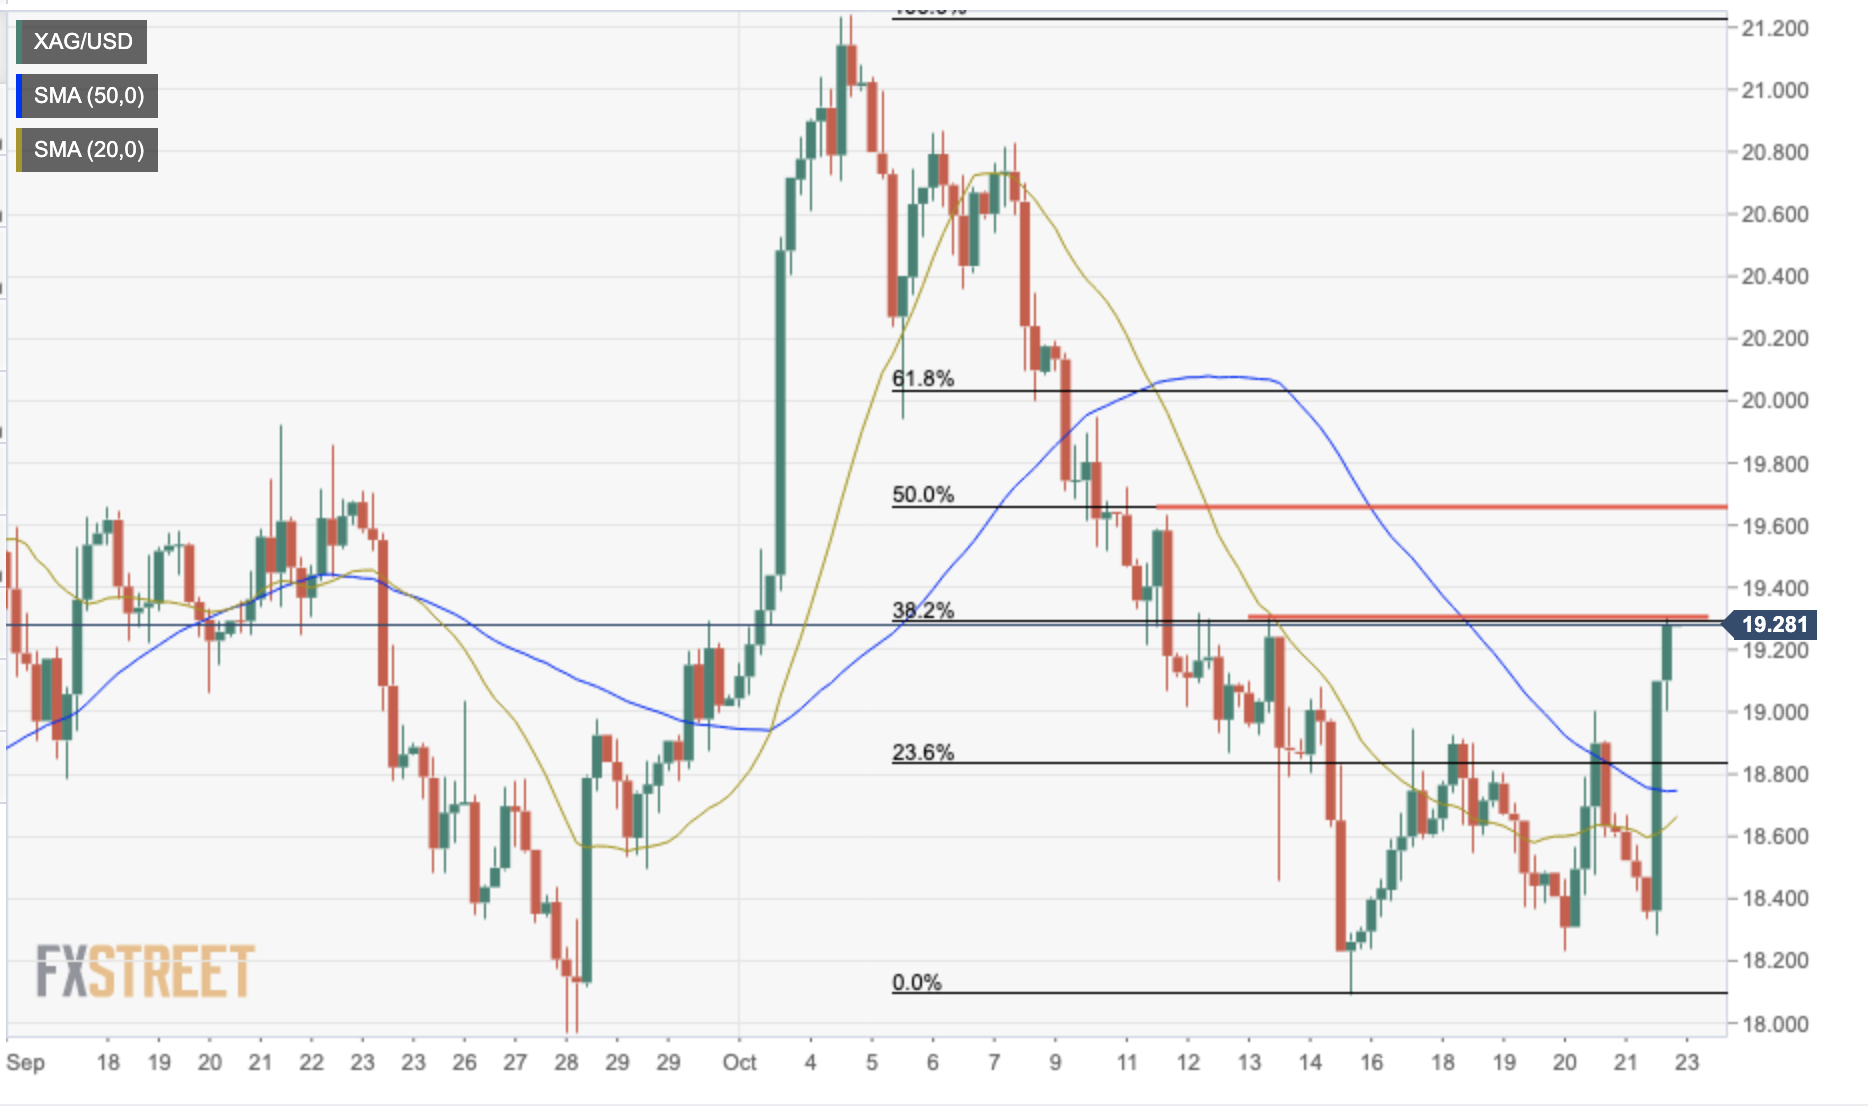
Silver prices have extended Thursday’s rebound from $18.30 lows on Friday, breaking beyond $19.00 and reaching one-week highs at $19.30 so far. The precious metal appreciates more than 3% on the day, retracing half of the ground lost on the previous week’s sell-off.
Precious metals appreciate against a softer USD
A news report by the Wall Street Journal has suggested Federal Reserve officials are open to debate on how to signal a smaller rate hike in December. This has offset the positive impact of the bank’s representative’s hawkish rhetoric and sent the US dollar tumbling across the board.
Furthermore, an alleged intervention by the Bank of Japan and the Japanese Finance Ministry has sent the yen surging across the board. The USD/JPY plunged more than 2.5%, as a consequence, and weighed the US dollar across the board.
XAG/USD pushing against key resistance at $19.30
From a technical perspective, the pair is now testing the resistance area at $19.30 (Oct. 13 high and the 38.7% Fib. Retracement of the October 4-10 decline). Above here, the next potential targets are $19.65 (50% retracement and Oct. 11 high) and the $20.00 level.
On the downside, below the $19.00 previous resistance area, the next potential targets could be the 20-period SMA in the 4-hour chart, now at $18.60, and October 14 low at $18.08.
XAG/USD 4-hour chart

Technical levels to watch
Information on these pages contains forward-looking statements that involve risks and uncertainties. Markets and instruments profiled on this page are for informational purposes only and should not in any way come across as a recommendation to buy or sell in these assets. You should do your own thorough research before making any investment decisions. FXStreet does not in any way guarantee that this information is free from mistakes, errors, or material misstatements. It also does not guarantee that this information is of a timely nature. Investing in Open Markets involves a great deal of risk, including the loss of all or a portion of your investment, as well as emotional distress. All risks, losses and costs associated with investing, including total loss of principal, are your responsibility. The views and opinions expressed in this article are those of the authors and do not necessarily reflect the official policy or position of FXStreet nor its advertisers.