Silver Price Analysis: XAG/USD rallies to multi-week high, closer to $23.75 confluence
|
- Silver scales higher for the fifth straight day and jumps to a nearly three-week high on Wednesday.
- A slightly overbought RSI on hourly charts warrants some caution before placing fresh bullish bets.
- Any meaningful corrective decline might now be seen as a buying opportunity and remain limited.
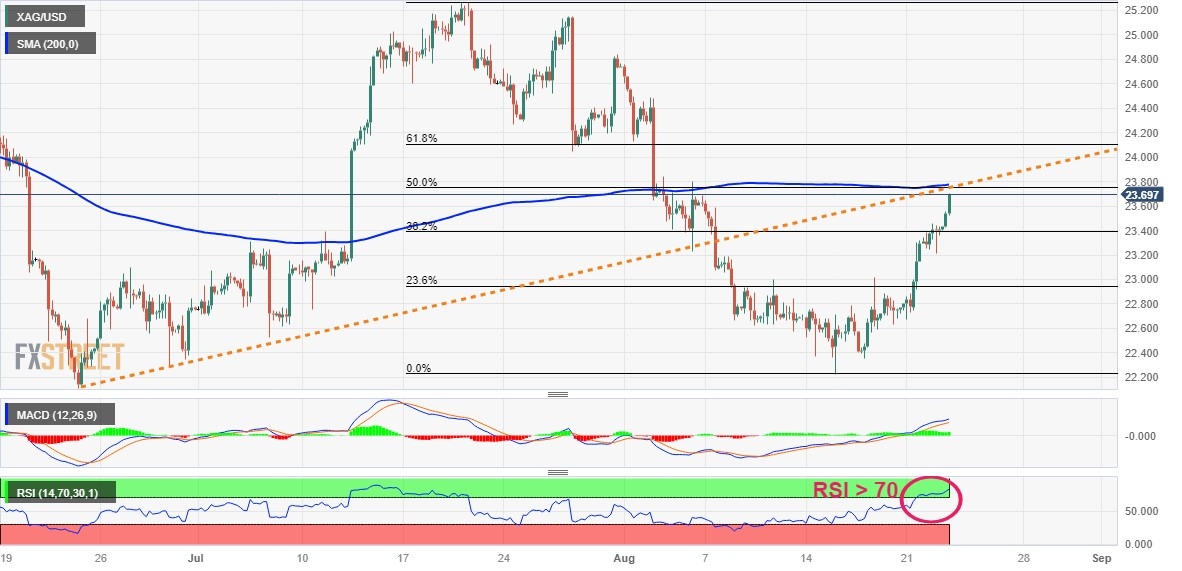
Silver prolongs its recent goodish rebound from the $22.20 area, or a nearly two-month low touched last week and gains strong follow-through traction for the fifth successive day on Wednesday. The momentum lifts the white metal to a two-and-half-week high during the early European session, closer to the $23.75 confluence barrier.
The said area comprises the 200-period Simple Moving Average (SMA) on the 4-hour chart, an ascending trend-line support breakpoint and the 50% Fibonacci retracement level of the July-August downfall. A sustained strength beyond will be seen as a fresh trigger for bullish traders. That said, the Relative Strength Index (RSI) on hourly charts is flashing overbought conditions and makes it prudent to wait for some intraday consolidation or a modest pullback before positioning for any further gains.
Technical indicators on the daily chart, however, have just started gaining positive traction and suggest that the path of least resistance for the XAG/USD is to the upside. Hence, any meaningful dip could attract fresh buyers and remain limited near the $23.40 region, or the 38.2% Fibo. level. The next relevant support is pegged near the $23.25 region, below which a fresh bout of technical selling could accelerate the fall and drag the XAG/USD towards the 23.6% Fibo. level, around the $23.00 mark.
Bulls, meanwhile, might wait for a convincing breakout through the $23.75 confluence, above which the XAG/USD could aim to reclaim the $24.00 round figure, which coincides with the 61.8% Fibo. level. Some follow-through buying might then lift the white metal to its next relevant hurdle near the $24.55-$24.60 region en route to the $25.00 psychological mark and the July monthly swing high, around the $25.25 zone.
Silver 4-hour chart
Technical levels to watch
Information on these pages contains forward-looking statements that involve risks and uncertainties. Markets and instruments profiled on this page are for informational purposes only and should not in any way come across as a recommendation to buy or sell in these assets. You should do your own thorough research before making any investment decisions. FXStreet does not in any way guarantee that this information is free from mistakes, errors, or material misstatements. It also does not guarantee that this information is of a timely nature. Investing in Open Markets involves a great deal of risk, including the loss of all or a portion of your investment, as well as emotional distress. All risks, losses and costs associated with investing, including total loss of principal, are your responsibility. The views and opinions expressed in this article are those of the authors and do not necessarily reflect the official policy or position of FXStreet nor its advertisers.
