Shopify (SHOP) rallied suggesting nest completed
|
Shopify Inc. is a Canadian multinational e-commerce company in Ottawa, Ontario. Shopify (SHOP) is the name of its proprietary e-commerce platform for online stores and retail point-of-sale systems. The Shopify platform offers online retailers a suite of services including payments, marketing, shipping and customer engagement tools.
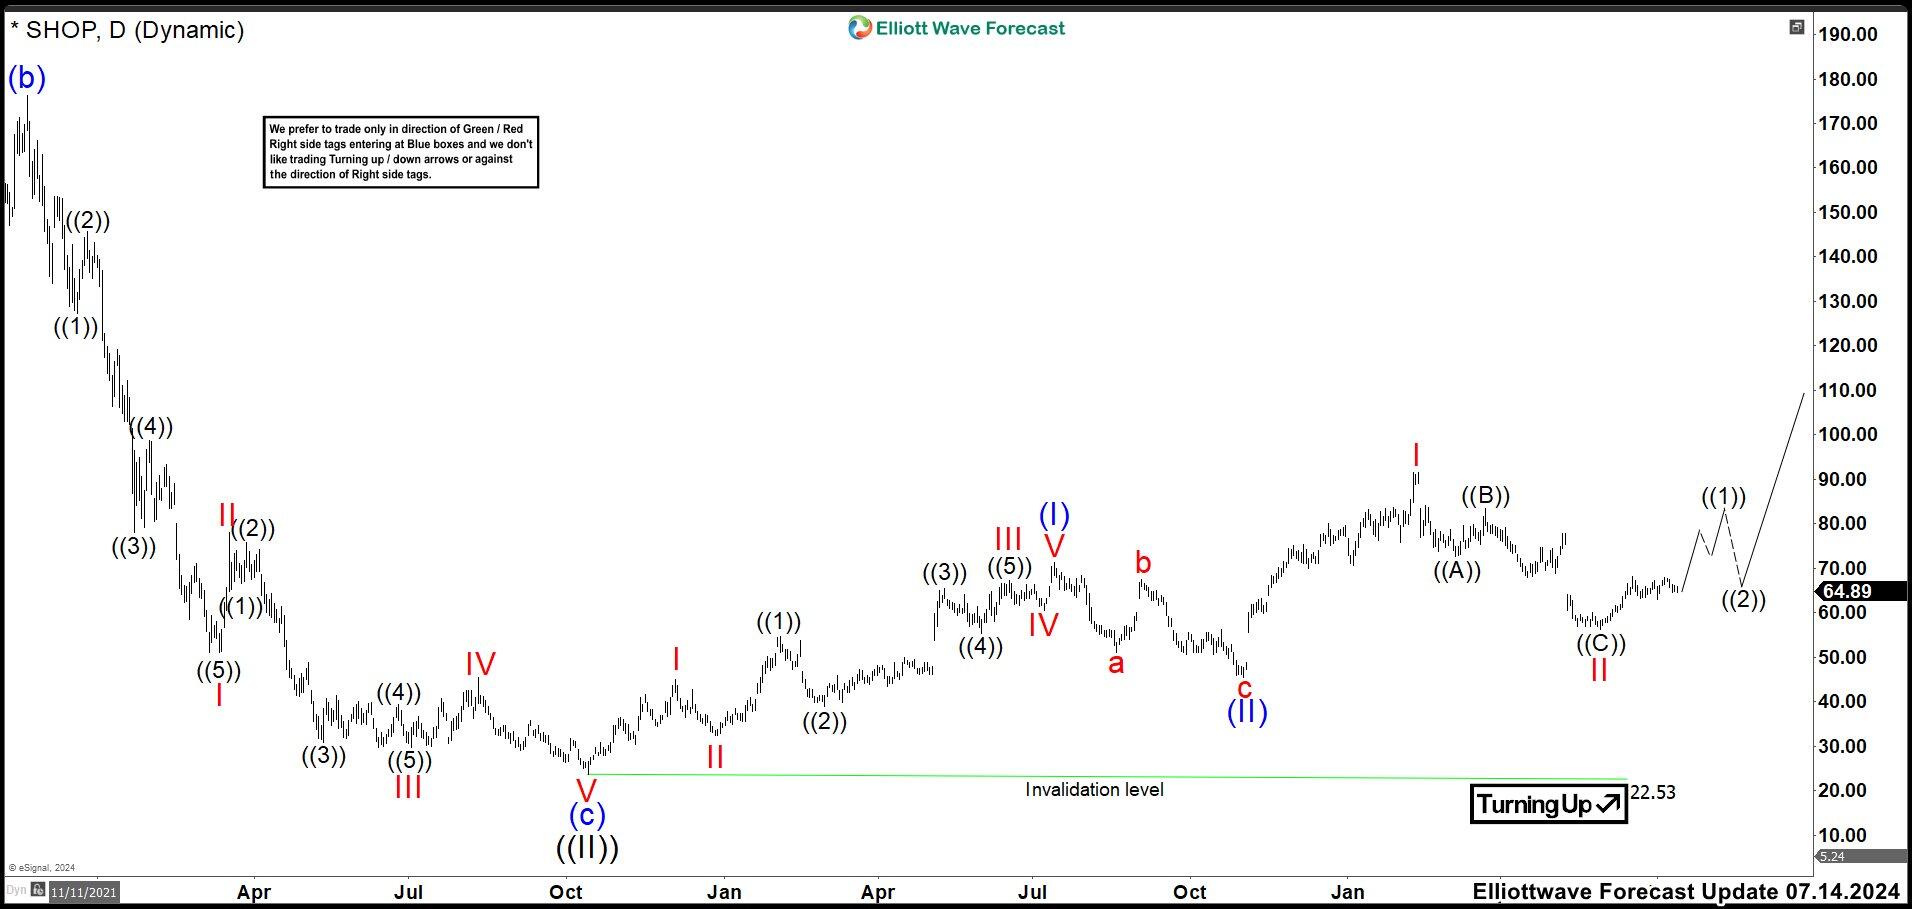
Shopify ended a Grand Supercycle in July 2021 and we labeled it as wave ((I)). Since then, it entered in a flat correction as wave ((II)). Three swings drop ended at 128.46 as Wave (a). Then market breaks above 164.88 in another 3 swings suggesting a possible flat correction and we labeled wave (b) at 176.49. Down from this price, SHOP built a perfect impulse lower completing a big short at 23.75 and we labeled as wave (c) and also wave ((II)).
SHOP daily chart July 2024
In the last chart, we saw a wave (I) ended at 71.43 high. The market broke below 60.22 indicating that wave (II) had arrived. This wave (II) developed a zig zag correction and ended at 45.50 low. From here, SHOP continued up ending another impulse as wave I at 94.57 high. Then, it did another correction and we called it wave II at 56.31 low forming the nest. We expected to continue up to complete another impulse like wave ((1)) and another correction ((2)) to make another nest until the market decides to resume the rally. The view was valid as the market stays above 56.31 low.
SHOP daily chart November 2024
In the current chart, the market broke the 56.31 low invalidating the last view, but it does not break 45.50 wave (II) low. Therefore, wave II did a double correction structure ended at 48.56 low. The market bounced ending wave ((1)) at 84.37 and pullback to 65.86 to complete wave ((2)) correction. Then, SHOP continued the rally breaking wave I high suggesting that wave III is on its way. The structure looks like an impulse and it should continue higher until wave III is finished. The best strategy for now, it is to buy dips after 3, 7 or 11 swings correction.
Information on these pages contains forward-looking statements that involve risks and uncertainties. Markets and instruments profiled on this page are for informational purposes only and should not in any way come across as a recommendation to buy or sell in these assets. You should do your own thorough research before making any investment decisions. FXStreet does not in any way guarantee that this information is free from mistakes, errors, or material misstatements. It also does not guarantee that this information is of a timely nature. Investing in Open Markets involves a great deal of risk, including the loss of all or a portion of your investment, as well as emotional distress. All risks, losses and costs associated with investing, including total loss of principal, are your responsibility. The views and opinions expressed in this article are those of the authors and do not necessarily reflect the official policy or position of FXStreet nor its advertisers.
