Russell 2000 (RTY) rally should fail for more downside [Video]
|![Russell 2000 (RTY) rally should fail for more downside [Video]](https://editorial.fxstreet.com/images/Macroeconomics/Countries/Europe/Eurozone_countries/brussels-eu-parliment-building-1500932_Small.jpg)
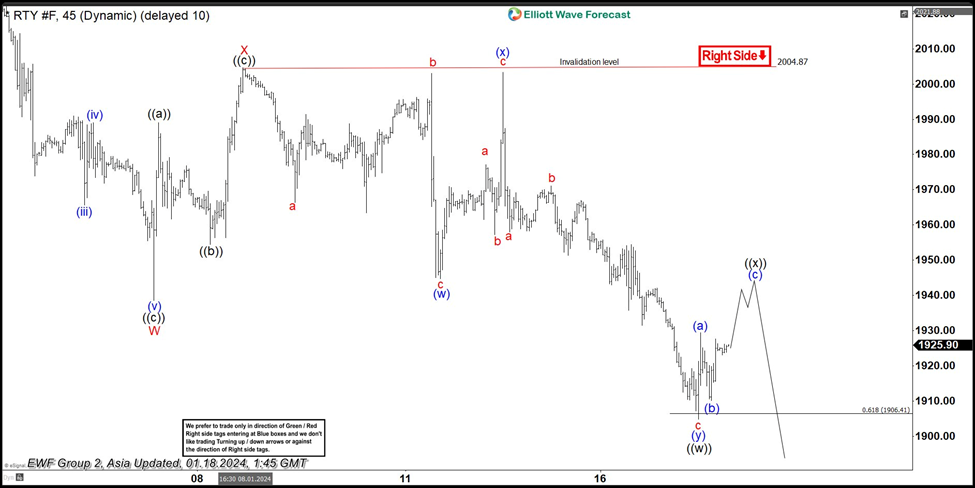
Short term Elliott Wave View in Russell 2000 (RTY) suggests the decline from 12.28.2023 high is unfolding as a double three Elliott Wave structure. Down from 12.28.2023 high, wave W ended at 1938.6 and wave X ended at 2004.87. Wave Y lower is in progress as another double three in lesser degree. Down from wave X, wave a ended at 1966.4 and wave b ended at 2003.10. Wave c lower ended at 1944.70 which completed wave (w). From there, wave (x) rally ended at t 2003.30 as a zigzag. Up from wave (w), wave a ended at 1977.10 and wave b ended at 1957.30. Wave c ended at 2003.30 which completed wave (x) in higher degree.
Russell 2000 (RTY_F) 45 minutes Elliott Wave chart
Index resumes lower in wave (y) with internal subdivision as a zigzag. Down from wave (x), wave a ended at 1958 and wave b rally ended at 1971.10. Wave c lower ended at 1904.80 which completed wave (y) of ((w)). Expect Index to rally in wave ((x)) to correct cycle from 1.9.2024 high before it resumes lower. Rally is unfolding as a zigzag where wave (a) ended at 1929.4 and wave (b) ended at 1910.10. Expect wave (c) higher to end at 1934.2 – 1949.9 area which should complete wave ((x)) in higher degree. Near term, as far as pivot at 2004.87 high stays intact, expect rally to fail in 3, 7, 11 swing for further downside.
RTY_F Elliott Wave video
Information on these pages contains forward-looking statements that involve risks and uncertainties. Markets and instruments profiled on this page are for informational purposes only and should not in any way come across as a recommendation to buy or sell in these assets. You should do your own thorough research before making any investment decisions. FXStreet does not in any way guarantee that this information is free from mistakes, errors, or material misstatements. It also does not guarantee that this information is of a timely nature. Investing in Open Markets involves a great deal of risk, including the loss of all or a portion of your investment, as well as emotional distress. All risks, losses and costs associated with investing, including total loss of principal, are your responsibility. The views and opinions expressed in this article are those of the authors and do not necessarily reflect the official policy or position of FXStreet nor its advertisers.

