NZD/USD Price Prediction: Rolls over and falls sharply to key support
|
- NZD/USD has rolled over and fallen to key support at around 0.6220.
- It may have formed a bearish Japanese candlestick pattern and the MACD has crossed below its signal line.
NZD/USD reaches a key resistance band at around the 0.6400 level and promptly reverses lower. It is in the process of forming three consecutive bearish days which in Japanese candlestick analysis is a bearish reversal sign called a “Three Black Crows” pattern (light blue shaded rectangle on chart below). If Thursday (today) ends as a long red candle it will confirm completion of such a pattern.
NZD/USD Daily Chart
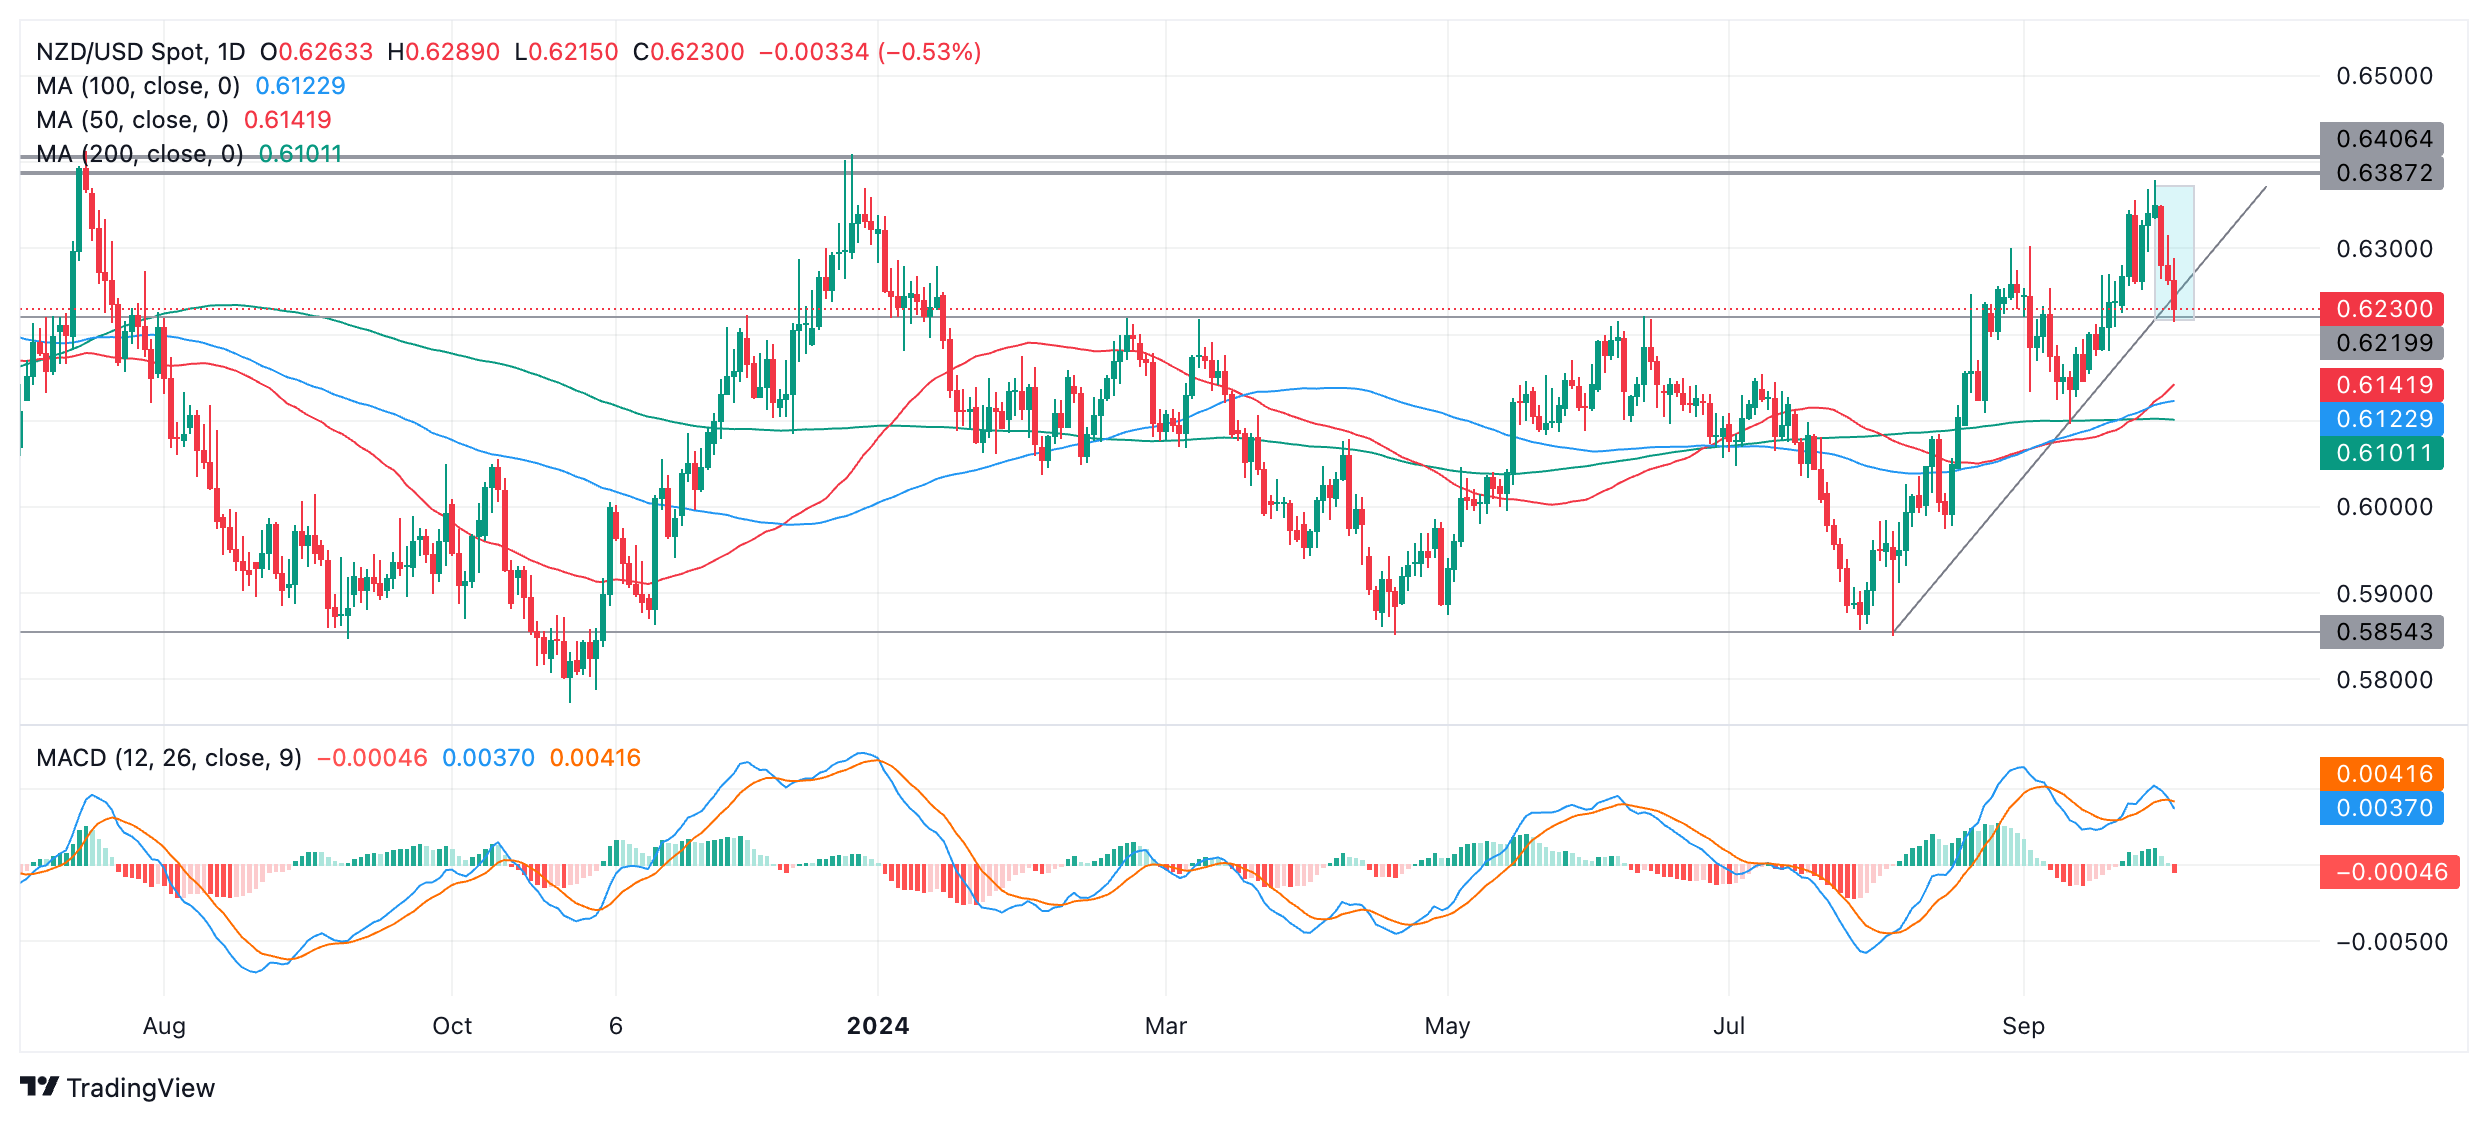
The move down from the September 30 peak has been sharp and accompanied by equally bearish momentum, increasing the chances it could extend further. However, it has just met a formidable support level at around 0.6220 composed of multiple price peaks in the first half of 2024. This is likely to pose an obstacle to bears wishing to push prices lower.
The blue Moving Average Divergence Convergence (MACD) has crossed below its red signal line which is a bearish signal.
There is a risk the market may be reversing and further downside could follow. This would particularly be the case if prices closed substantially below the 0.6220 support level, perhaps at 0.6200 or lower.
However, such a move would soon meet further tough support from the cluster of major Simple Moving Averages (SMA) not far below, starting with the 50-day SMA at 0.6141, but followed by the 100 and 200-days at roughly 0.6120 and 0.6101 respectively.
Further, it is also possible the Kiwi pair could rally from the current support level in the 0.6220s and resume its prior more-bullish trend. Yet any substantial upside progress is likely to be stymied by tough resistance at around 0.6400 from prior highs in July and December 2023.
Information on these pages contains forward-looking statements that involve risks and uncertainties. Markets and instruments profiled on this page are for informational purposes only and should not in any way come across as a recommendation to buy or sell in these assets. You should do your own thorough research before making any investment decisions. FXStreet does not in any way guarantee that this information is free from mistakes, errors, or material misstatements. It also does not guarantee that this information is of a timely nature. Investing in Open Markets involves a great deal of risk, including the loss of all or a portion of your investment, as well as emotional distress. All risks, losses and costs associated with investing, including total loss of principal, are your responsibility. The views and opinions expressed in this article are those of the authors and do not necessarily reflect the official policy or position of FXStreet nor its advertisers.