NZD/USD Price Forecast: Remains subdued below nine-day EMA at 0.5650
|
- NZD/USD could explore the area around the psychological level of 0.5600.
- The 14-day RSI remains below the 50 mark, strengthening the bearish sentiment.
- The immediate barrier appears at the nine-day EMA of 0.5650 level.
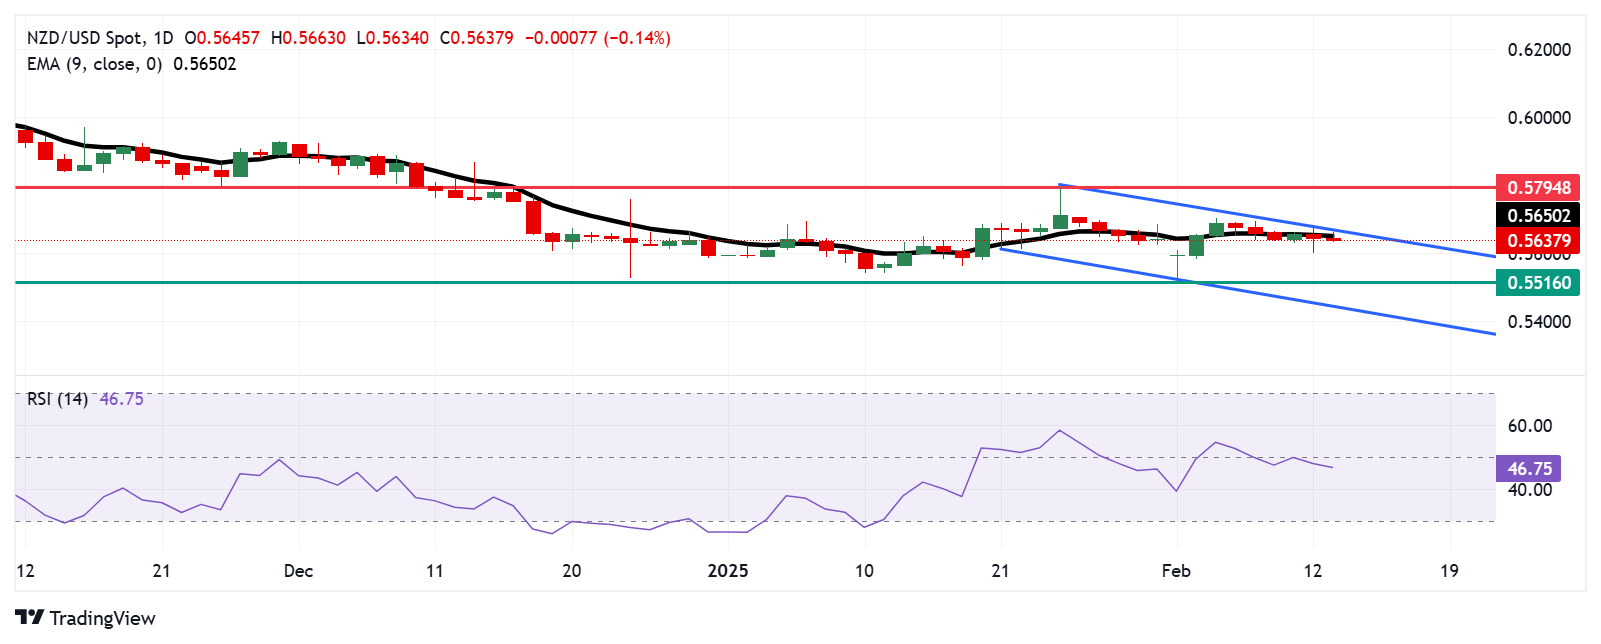
The NZD/USD pair continues its decline for the second consecutive day, trading near 0.5640 during European hours on Thursday. Technical analysis of the daily chart indicates a bearish market sentiment, with the pair remaining within a descending channel pattern.
The 14-day Relative Strength Index (RSI) stays below the 50 mark, reinforcing the bearish outlook. Additionally, the NZD/USD pair remains under the nine-day Exponential Moving Average (EMA), signaling weak short-term momentum.
On the downside, the NZD/USD pair could explore the support region around the psychological level of 0.5600. A decisive break below this level could drive the pair toward 0.5516, its lowest point since October 2022, recorded on February 3. Further support lies near the lower boundary of the descending channel at 0.5450.
To the upside, the NZD/USD pair's immediate resistance is at the nine-day EMA of 0.5650, followed by the descending channel’s lower boundary at 0.5670. A breakout above this critical resistance zone could ease the bearish bias, potentially pushing the pair toward its nine-week high of 0.5794, reached on January 24.
NZD/USD: Daily Chart
New Zealand Dollar PRICE Today
The table below shows the percentage change of New Zealand Dollar (NZD) against listed major currencies today. New Zealand Dollar was the weakest against the Swiss Franc.
| USD | EUR | GBP | JPY | CAD | AUD | NZD | CHF | |
|---|---|---|---|---|---|---|---|---|
| USD | -0.24% | -0.28% | -0.32% | 0.08% | 0.25% | 0.12% | -0.65% | |
| EUR | 0.24% | -0.04% | -0.06% | 0.32% | 0.47% | 0.37% | -0.41% | |
| GBP | 0.28% | 0.04% | -0.06% | 0.37% | 0.53% | 0.41% | -0.37% | |
| JPY | 0.32% | 0.06% | 0.06% | 0.40% | 0.57% | 0.40% | -0.33% | |
| CAD | -0.08% | -0.32% | -0.37% | -0.40% | 0.18% | 0.05% | -0.74% | |
| AUD | -0.25% | -0.47% | -0.53% | -0.57% | -0.18% | -0.12% | -0.90% | |
| NZD | -0.12% | -0.37% | -0.41% | -0.40% | -0.05% | 0.12% | -0.78% | |
| CHF | 0.65% | 0.41% | 0.37% | 0.33% | 0.74% | 0.90% | 0.78% |
The heat map shows percentage changes of major currencies against each other. The base currency is picked from the left column, while the quote currency is picked from the top row. For example, if you pick the New Zealand Dollar from the left column and move along the horizontal line to the US Dollar, the percentage change displayed in the box will represent NZD (base)/USD (quote).
Information on these pages contains forward-looking statements that involve risks and uncertainties. Markets and instruments profiled on this page are for informational purposes only and should not in any way come across as a recommendation to buy or sell in these assets. You should do your own thorough research before making any investment decisions. FXStreet does not in any way guarantee that this information is free from mistakes, errors, or material misstatements. It also does not guarantee that this information is of a timely nature. Investing in Open Markets involves a great deal of risk, including the loss of all or a portion of your investment, as well as emotional distress. All risks, losses and costs associated with investing, including total loss of principal, are your responsibility. The views and opinions expressed in this article are those of the authors and do not necessarily reflect the official policy or position of FXStreet nor its advertisers.