NZD/USD Price Analysis: Tests the psychological support of 0.6100 level
|
- NZD/USD extends losses to the psychological support of 0.6100 on Friday.
- Technical analysis suggests a bearish momentum to revisit March’s low at 0.6068.
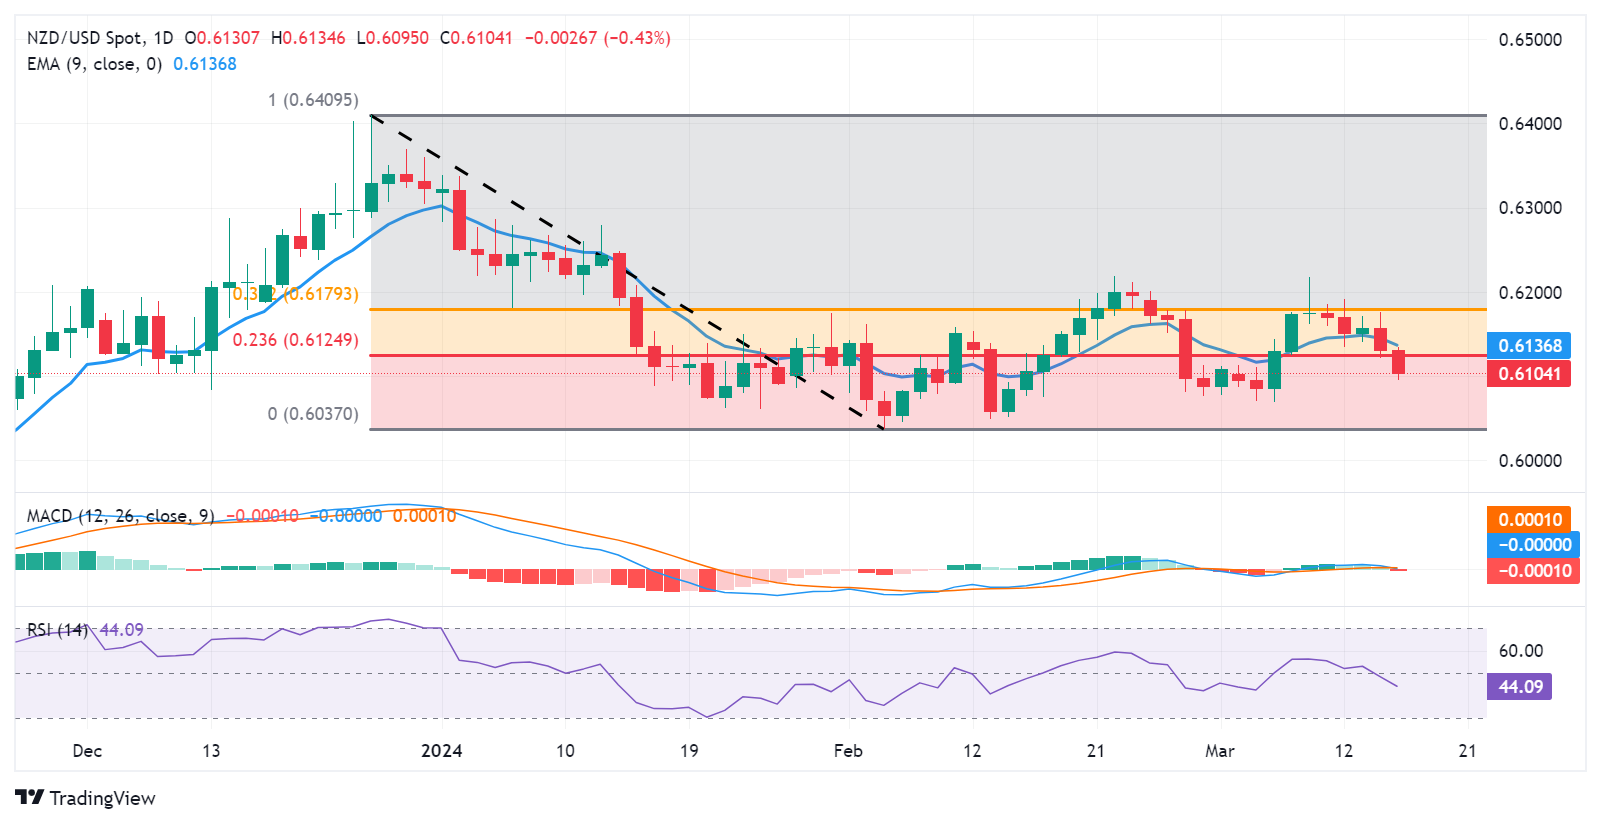
- The key resistance zone appears around the 23.6% Fibonacci retracement level of 0.6124 and the nine-day EMA at 0.6137.
NZD/USD moves in the negative direction, extending its losses to near the psychological support of 0.6100 during the early European session on Friday. A decisive move below this level could exert downward pressure on the pair to navigate the area around March’s low at 0.6068 and a major support of 0.6050 level.
A break below the latter could lead the NZD/USD pair to revisit February’s low at 0.6037, followed by the psychological support at 0.6000. Traders will closely monitor these levels for potential shifts in market sentiment.
According to the Moving Average Convergence Divergence (MACD) analysis, a prevailing downward sentiment is indicated for the NZD/USD pair. The MACD line is positioned below both the centerline and the signal line, signaling a bearish trend. Additionally, the 14-day Relative Strength Index (RSI) is below the 50 level, providing further confirmation of the bearish sentiment.
On the upside, the NZD/USD pair could find a key barrier lies at the 23.6% Fibonacci retracement level at 0.6124, followed by the nine-day Exponential Moving Average (EMA) of 0.6137. The pair could face further resistance barriers if it climbs higher, with key levels anticipated at 0.6150, followed by the 38.2% Fibonacci retracement level of 0.6179.
NZD/USD: Daily Chart
Information on these pages contains forward-looking statements that involve risks and uncertainties. Markets and instruments profiled on this page are for informational purposes only and should not in any way come across as a recommendation to buy or sell in these assets. You should do your own thorough research before making any investment decisions. FXStreet does not in any way guarantee that this information is free from mistakes, errors, or material misstatements. It also does not guarantee that this information is of a timely nature. Investing in Open Markets involves a great deal of risk, including the loss of all or a portion of your investment, as well as emotional distress. All risks, losses and costs associated with investing, including total loss of principal, are your responsibility. The views and opinions expressed in this article are those of the authors and do not necessarily reflect the official policy or position of FXStreet nor its advertisers.