NZD/USD Price Analysis: Posts fresh four-month high near 0.6220 after soft US Inflation report
|
- NZD/USD refreshes four-month high near 0.6220 as softer-than-expected US CPI report boosts Fed rate-cut bets for September.
- Investors await the Fed’s policy decision.
- The Kiwi asset sets to deliver an Inverted H&S breakout.
The NZD/USD pair shoots to a four-month high near 0.6220 in Wednesday’s New York session. The Kiwi asset strengthens as the soft United States (US) Consumer Price Index (CPI) report for May has boosted the Federal Reserve’s (Fed) rate-cut bets for the September meeting, which has improved the risk appetite of market participants significantly.
Meanwhile, market volatility is expected to remain high as investors brace for Fed’s monetary policy outcome in the late New York session. The Fed is expected to leave interest rates unchanged in the range of 5.25%-5.50%.
Investors will majorly focus on the Fed’s dot-plot, which indicates where policymakers see interest rates heading. Fed officials are expected to project fewer rate cuts than three anticipated in March as they lack confidence that inflation will sustaining return to the 2% target. However, soft inflation for May would improve their confidence that the disinflation process has resumed.
On the Kiwi front, firm expectations that the Reserve Bank of New Zealand (RBNZ) will keep interest rates at their current levels for the entire year has kept the New Zealand Dollar upbeat.
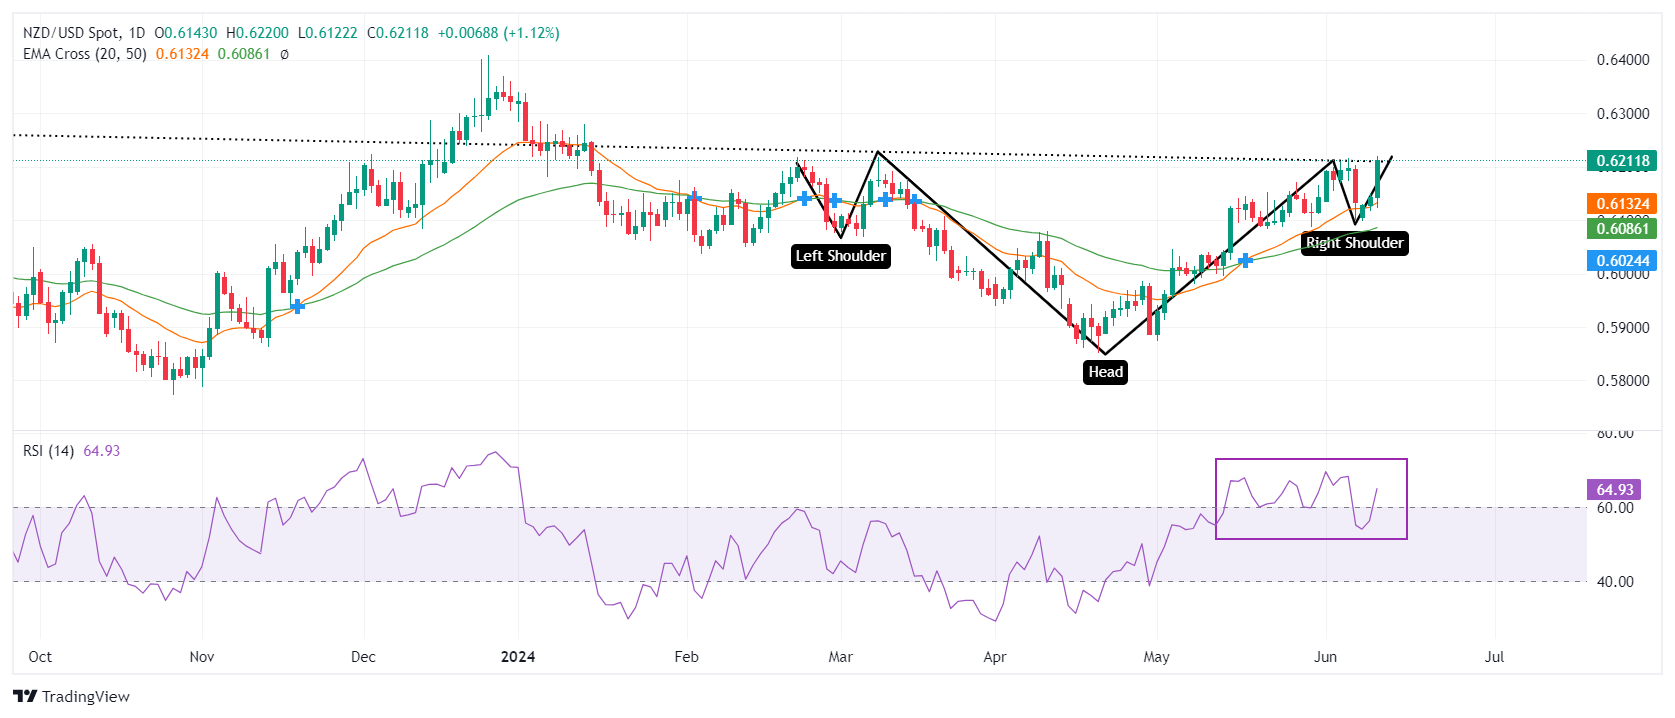
NZD/USD seems confident to deliver a breakout of the Inverted Head and Shoulder (H&S) chart pattern on a daily timeframe. A breakout move of the above-mentioned chart formation results in a bullish reversal. The 20-day Exponential Moving Average (EMA) near 0.6130 continues to remain a major cushion for the New Zealand Dollar bulls. Upward-sloping 50-DEMA near 0.6085 suggests that the overall trend is bullish.
The 14-period Relative Strength Index (RSI) jumps into the 60.00-80.00 range. Should the oscillator establish itself in this range, momentum would lean toward the upside.
More upside would appear if the asset stabilizes above the intraday high of 0.6220, which will expose the asset January 15 high near 0.6250, followed by January 12 high near 0.6280.
On the contrary, fresh downside would appear if the asset breaks below April 4 high around 0.6050 This would drag the asset towards the psychological support of 0.6000 and April 25 high at 0.5969.
NZD/USD daily chart
Information on these pages contains forward-looking statements that involve risks and uncertainties. Markets and instruments profiled on this page are for informational purposes only and should not in any way come across as a recommendation to buy or sell in these assets. You should do your own thorough research before making any investment decisions. FXStreet does not in any way guarantee that this information is free from mistakes, errors, or material misstatements. It also does not guarantee that this information is of a timely nature. Investing in Open Markets involves a great deal of risk, including the loss of all or a portion of your investment, as well as emotional distress. All risks, losses and costs associated with investing, including total loss of principal, are your responsibility. The views and opinions expressed in this article are those of the authors and do not necessarily reflect the official policy or position of FXStreet nor its advertisers.