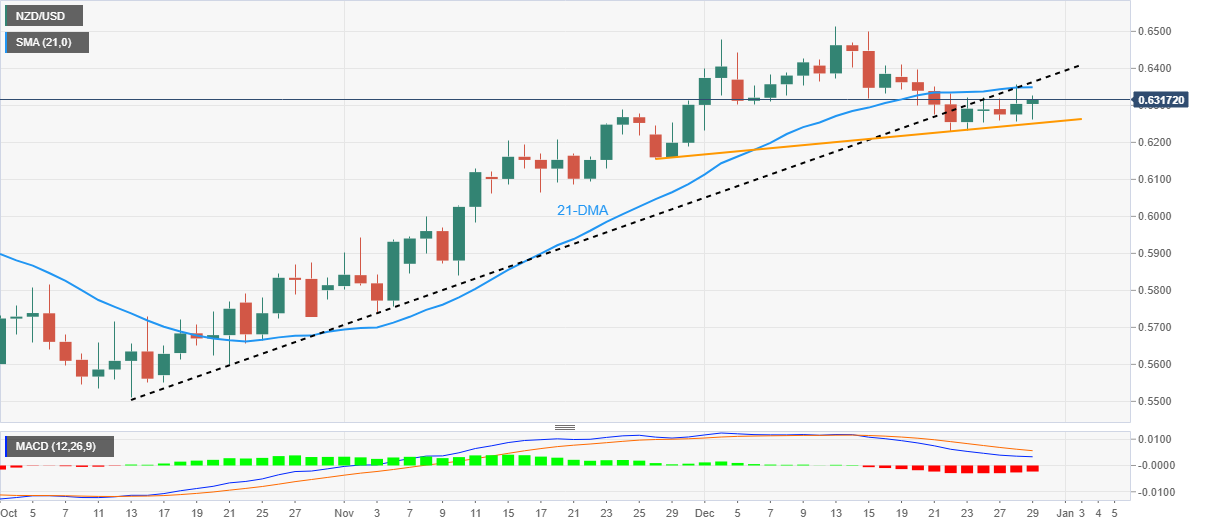
NZD/USD Price Analysis: Further upside remains elusive below 0.6365 support-turned-resistance
|
- NZD/USD struggles to defend two-day uptrend, seesaws around intraday high.
- Bearish MACD signals, sustained trading below 21-DMA keep sellers hopeful.
- One-month-old ascending trend line restricts immediate downside before the monthly low.
NZD/USD makes rounds to 0.6320 while printing mild gains for the second consecutive day during early Thursday.
In doing so, the Kiwi pair defends the previous weekly rebound from a one-month-old ascending support line, as well as portrays a struggle to cross the 21-DMA hurdle amid bearish MACD signals.
In addition to the 21-DMA level surrounding 0.6350, the previous support line stretched from October 13, now resistance around 0.6365, also challenges the NZD/USD buyers.
Even if the quote crosses the 0.6365 hurdle, the 0.6400 round figure and the monthly peak of 0.6514 could restrict the pair’s further upside. It should be noted that the NZD/USD pair’s successful trading beyond 0.6515 will need validation from June’s peak of 0.6575.
Hence, multiple hurdles stand ready to challenge the Kiwi pair’s latest recovery.
On the flip side, an upward-sloping support line from late November, close to 0.6250 by the press time, restricts the immediate downside of the NZD/USD price.
Following that, the bears may aim for the monthly lows and troughs marked during late November, respectively around 0.6230 and 0.6155.
It’s worth mentioning that the multiple lows marked during mid-November, around 0.6065-60 could challenge the NZD/USD bears past 0.6155, a break of which won’t hesitate to challenge the 0.6000 psychological magnet.
NZD/USD: Daily chart
Trend: Limited upside expected
Information on these pages contains forward-looking statements that involve risks and uncertainties. Markets and instruments profiled on this page are for informational purposes only and should not in any way come across as a recommendation to buy or sell in these assets. You should do your own thorough research before making any investment decisions. FXStreet does not in any way guarantee that this information is free from mistakes, errors, or material misstatements. It also does not guarantee that this information is of a timely nature. Investing in Open Markets involves a great deal of risk, including the loss of all or a portion of your investment, as well as emotional distress. All risks, losses and costs associated with investing, including total loss of principal, are your responsibility. The views and opinions expressed in this article are those of the authors and do not necessarily reflect the official policy or position of FXStreet nor its advertisers.