Newmont Corporation Elliott Wave technical forecast [Video]
|![Newmont Corporation Elliott Wave technical forecast [Video]](https://editorial.fxstreet.com/images/TechnicalAnalysis/ChartPatterns/PointFigure/hand-drawing-stock-chart-63151915_Small.jpg)
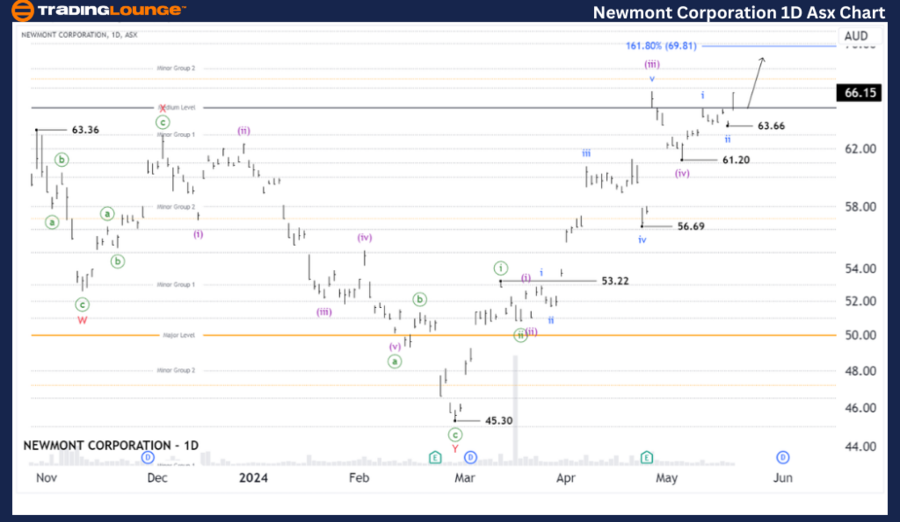
ASX: NEWMONT CORPORATION - NEM Elliott Elliott Wave Technical Analysis TradingLounge (1D Chart)
Greetings, Our Elliott Wave analysis today updates the Australian Stock Exchange (ASX) with NEWMONT CORPORATION - NEM. We have determined that NEM is likely to continue to rise even higher with wave (v)-purple.
ASX: Newmont Corporation – NEM Elliott Wave technical analysis
Function: Major trend (Minute degree, green).
Mode: Motive.
Structure: Impulse.
Position: Wave iii-blue of Wave (v)-purple.
Details: The short-term outlook indicates that wave (iv)-purple has ended sooner than expected, and wave (v)-purple is unfolding to push higher. Now, waves i and ii-blue have just completed, and wave iii-blue is unfolding to push higher, targeting 69.81. It is essential for the price to remain above 63.66 to maintain this outlook.
Invalidation point: 63.66.
ASX: Newmont Corporation – NEM four-hour chart analysis
Function: Major trend (Minute degree, green).
Mode: Motive.
Structure: Impulse.
Position: Wave ((1))-red of Wave iii-blue of Wave (v)-purple of Wave ((iii))-green.
Details: An even shorter-term outlook shows that wave (v)-purple is unfolding to push higher. It is subdividing into waves i and ii-blue, which have just completed. Now, wave iii-blue is beginning to unfold to push higher. This wave iii-blue is subdividing into wave ((1))-red, and wave ((2))-red might unfold next, setting the stage for wave ((3))-red to continue pushing higher, targeting 69.81 - 70.00.
Invalidation point: 63.66.
Conclusion
Our analysis, forecast of contextual trends, and short-term outlook for ASX: NEWMONT CORPORATION - NEM aim to provide readers with insights into the current market trends and how to capitalize on them effectively. We offer specific price points that act as validation or invalidation signals for our wave count, enhancing the confidence in our perspective. By combining these factors, we strive to offer readers the most objective and professional perspective on market trends.
Newmont Corporation Elliott Wave technical forecast [Video]

Information on these pages contains forward-looking statements that involve risks and uncertainties. Markets and instruments profiled on this page are for informational purposes only and should not in any way come across as a recommendation to buy or sell in these assets. You should do your own thorough research before making any investment decisions. FXStreet does not in any way guarantee that this information is free from mistakes, errors, or material misstatements. It also does not guarantee that this information is of a timely nature. Investing in Open Markets involves a great deal of risk, including the loss of all or a portion of your investment, as well as emotional distress. All risks, losses and costs associated with investing, including total loss of principal, are your responsibility. The views and opinions expressed in this article are those of the authors and do not necessarily reflect the official policy or position of FXStreet nor its advertisers.