Hang Seng Index Elliott Wave technical analysis [Video]
|![Hang Seng Index Elliott Wave technical analysis [Video]](https://editorial.fxstreet.com/images/Markets/Equities/HangSeng/hang-seng-index-17452117_Small.jpg)
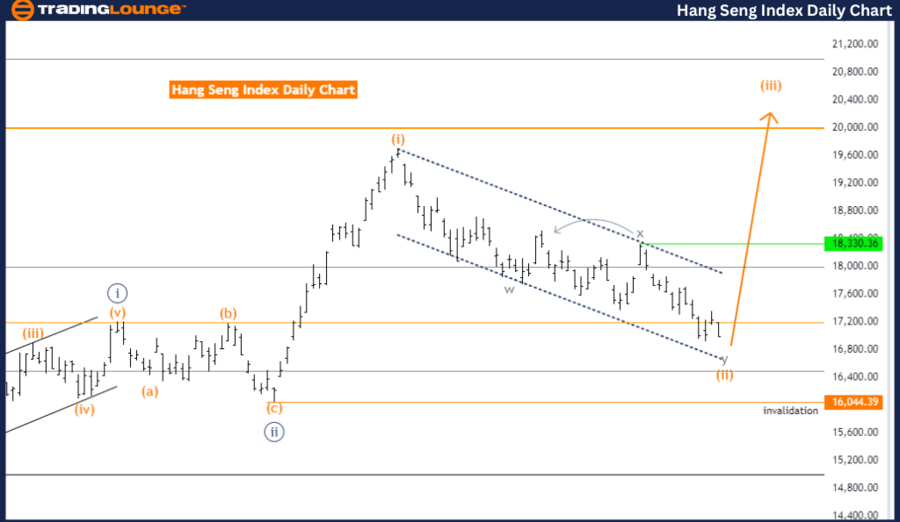
Hang Seng Index Elliott Wave technical analysis
Function: Counter trend.
Mode: Corrective.
Structure: Orange Wave 2.
Position: Navy Blue Wave 3.
Direction next higher degrees: Orange Wave 3.
Details: Orange Wave 2 is still active and appears close to completion. The invalidation level for this wave is set at 16044.39.
The Hang Seng Index Elliott Wave Analysis on the day chart indicates a counter-trend function in a corrective mode. The analysis focuses on the structure of Orange Wave 2, which is positioned within Navy Blue Wave 3. This suggests the market is experiencing a correction phase within the broader trend, pointing to possible consolidation or retracement.
The details reveal that Orange Wave 2 is nearing its end, implying that the market may soon complete this corrective phase. Once Orange Wave 2 concludes, it will signal the start of Orange Wave 3, marking the resumption of the primary trend.
The next higher degree direction is expected to be Orange Wave 3. This shift from the current corrective phase to a new impulsive phase should bring renewed momentum and potential trading opportunities.
An important aspect of this analysis is the wave cancel invalid level, which is 16044.39. This level is crucial for confirming the current wave analysis. If the market price drops below this point, the current wave count would be invalidated, requiring a reevaluation of the wave structure and possibly altering the market outlook.
In summary, the Hang Seng Index day chart analysis shows the market is in a corrective phase within Orange Wave 2, positioned in Navy Blue Wave 3. The corrective phase appears close to ending, indicating an impending transition to Orange Wave 3. The wave cancel invalid level of 16044.39 is a critical threshold for validating this analysis and reassessing the wave structure if exceeded.
Elliott Wave analysis trading lounge weekly chart
Function: Counter Trend.
Mode: Corrective.
Structure: Orange Wave 2.
Position: Navy Blue Wave 3.
Direction next higher degrees: Orange Wave 3.
Details: Orange Wave 2 is still active and appears close to completion. The wave cancellation invalid level is set at 16044.39.
The Hang Seng Index Elliott Wave Analysis on the weekly chart highlights a counter-trend function in a corrective mode. The analysis focuses on the structure of Orange Wave 2, which is positioned within Navy Blue Wave 3. This suggests the index is currently in a corrective phase within the larger upward trend represented by Navy Blue Wave 3.
The details indicate that Orange Wave 2 is nearing its end, implying that the corrective phase is almost over. The index is likely to transition soon into the next wave, Orange Wave 3. The completion of Orange Wave 2 will mark the end of the current consolidation or retracement period, signaling the start of a new impulsive phase with potential upward movement.
The next higher degree direction is identified as Orange Wave 3. This transition indicates that, after Orange Wave 2 concludes, the index will move into Orange Wave 3, suggesting a resumption of the primary upward trend. This change is expected to bring renewed momentum and may present trading opportunities for those looking to capitalize on the new phase.
A crucial aspect of this analysis is the wave cancel invalid level, set at 16044.39. This level serves as a key threshold for validating the current wave analysis. If the index falls below this level, the current wave count would be invalidated, indicating that the expected wave pattern is no longer valid. This would require a reevaluation of the wave count and could potentially alter the market outlook.
In summary, the Hang Seng Index weekly chart analysis shows the index is in a corrective phase within Orange Wave 2, positioned in Navy Blue Wave 3. This phase is nearing completion, suggesting an impending transition to Orange Wave 3. The wave cancel invalid level of 16044.39 is essential for validating the current analysis, serving as a critical threshold to reassess the wave structure if exceeded.
Hang Seng Index Elliott Wave technical analysis [Video]

Information on these pages contains forward-looking statements that involve risks and uncertainties. Markets and instruments profiled on this page are for informational purposes only and should not in any way come across as a recommendation to buy or sell in these assets. You should do your own thorough research before making any investment decisions. FXStreet does not in any way guarantee that this information is free from mistakes, errors, or material misstatements. It also does not guarantee that this information is of a timely nature. Investing in Open Markets involves a great deal of risk, including the loss of all or a portion of your investment, as well as emotional distress. All risks, losses and costs associated with investing, including total loss of principal, are your responsibility. The views and opinions expressed in this article are those of the authors and do not necessarily reflect the official policy or position of FXStreet nor its advertisers.