Gold Price Forecast: XAUUSD tumbles to near $1,760 as risk aversion escalates
|
- Gold price has tumbled to near $1,763.00 as the risk-on profile has faded.
- Geopolitical tensions between North Korea and the US have improved safe haven’s appeal.
- Fed Daly’s hawkish commentary has supported the US Treasury yields.
Gold price (XAUUSD) has witnessed a steep fall after surrendering the critical support of $1,770.00 in the Asian session. The precious metal has tumbled to near $1,763.00 as investors are turning risk-averse after North Korea warns the US that it will face ruthless military activity against its joint drills in its region.
North Korea's foreign minister, Choe Son Hui, slammed a recent trilateral summit between the United States, South Korea, and Japan, during which the leaders criticized Pyongyang's weapons tests and pledged greater security cooperation, as reported by Reuters. This has triggered the risk of geopolitical tensions, which has improved the appeal for safe-haven assets.
The entire recovery witnessed in S&P500 futures in Asia has faded now as investors’ risk appetite has trimmed. Meanwhile, the 10-year US Treasury yields have rebounded to 3.72% as San Francisco Fed President Mary Daly hiked its interest rate guidance. Fed policymaker has considered a range of 4.75% - 5.25% as reasonable for the policy rate end-point. She further added that the central bank wants to see a slowdown in the economy to cool down the red-hot inflation.
Gold technical analysis
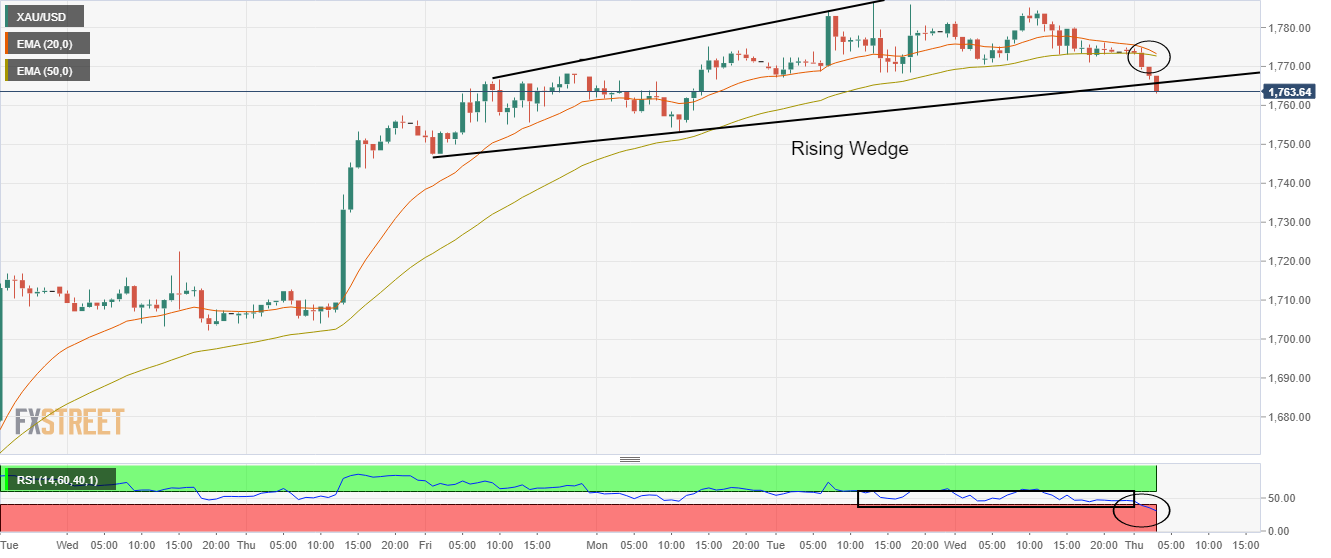
Gold price has delivered a downside break of a Rising Wedge chart pattern that indicates exhaustion in the upside momentum. The 20-and 50-period Exponential Moving Averages (EMAs) are on the verge of delivering a bearish crossover of around $1,772.90. Meanwhile, the Relative Strength Index (RSI) (14) has shifted into the bearish range of 20.00-40.00, which indicates more downside in the asset ahead.
Gold hourly chart
Information on these pages contains forward-looking statements that involve risks and uncertainties. Markets and instruments profiled on this page are for informational purposes only and should not in any way come across as a recommendation to buy or sell in these assets. You should do your own thorough research before making any investment decisions. FXStreet does not in any way guarantee that this information is free from mistakes, errors, or material misstatements. It also does not guarantee that this information is of a timely nature. Investing in Open Markets involves a great deal of risk, including the loss of all or a portion of your investment, as well as emotional distress. All risks, losses and costs associated with investing, including total loss of principal, are your responsibility. The views and opinions expressed in this article are those of the authors and do not necessarily reflect the official policy or position of FXStreet nor its advertisers.
