Gold Price Forecast: XAU/USD seesaws around $1,850 after hawkish FOMC minutes
|
- Gold reacted downwards towards the low $1,840s on the release.
- FOMC: Officials do not expect to cut rates in 2023.
- FOMC: Policymakers did not express the size for further rate hikes.
Gold price clings to gains around $1850 following the release of the Federal Reserve’s Open Market Committee (FOMC) minutes for the last meeting, which emphasized the need for the central bank to tighten conditions amid stubbornly high inflation levels. At the time of writing, the XAG/USD is trading at around $1,850.
Summary of the FOMC minutes
The December minutes showed that policymakers agreed to slow the pace of interest rate hikes but added that a slowdown is not a “weakening commitment to achieving price stability on that inflation is already on a persistent downward path.” Fed officials added that the US central bank had made significant progress in moving to restrictive policies and added that no rate cuts would be necessary for 2023.
Additionally, policymakers added that inflation risks could be more persistent and that further increases to the Federal Funds rate (FFR) would be appropriate.
US Dollar and Gold’s reaction
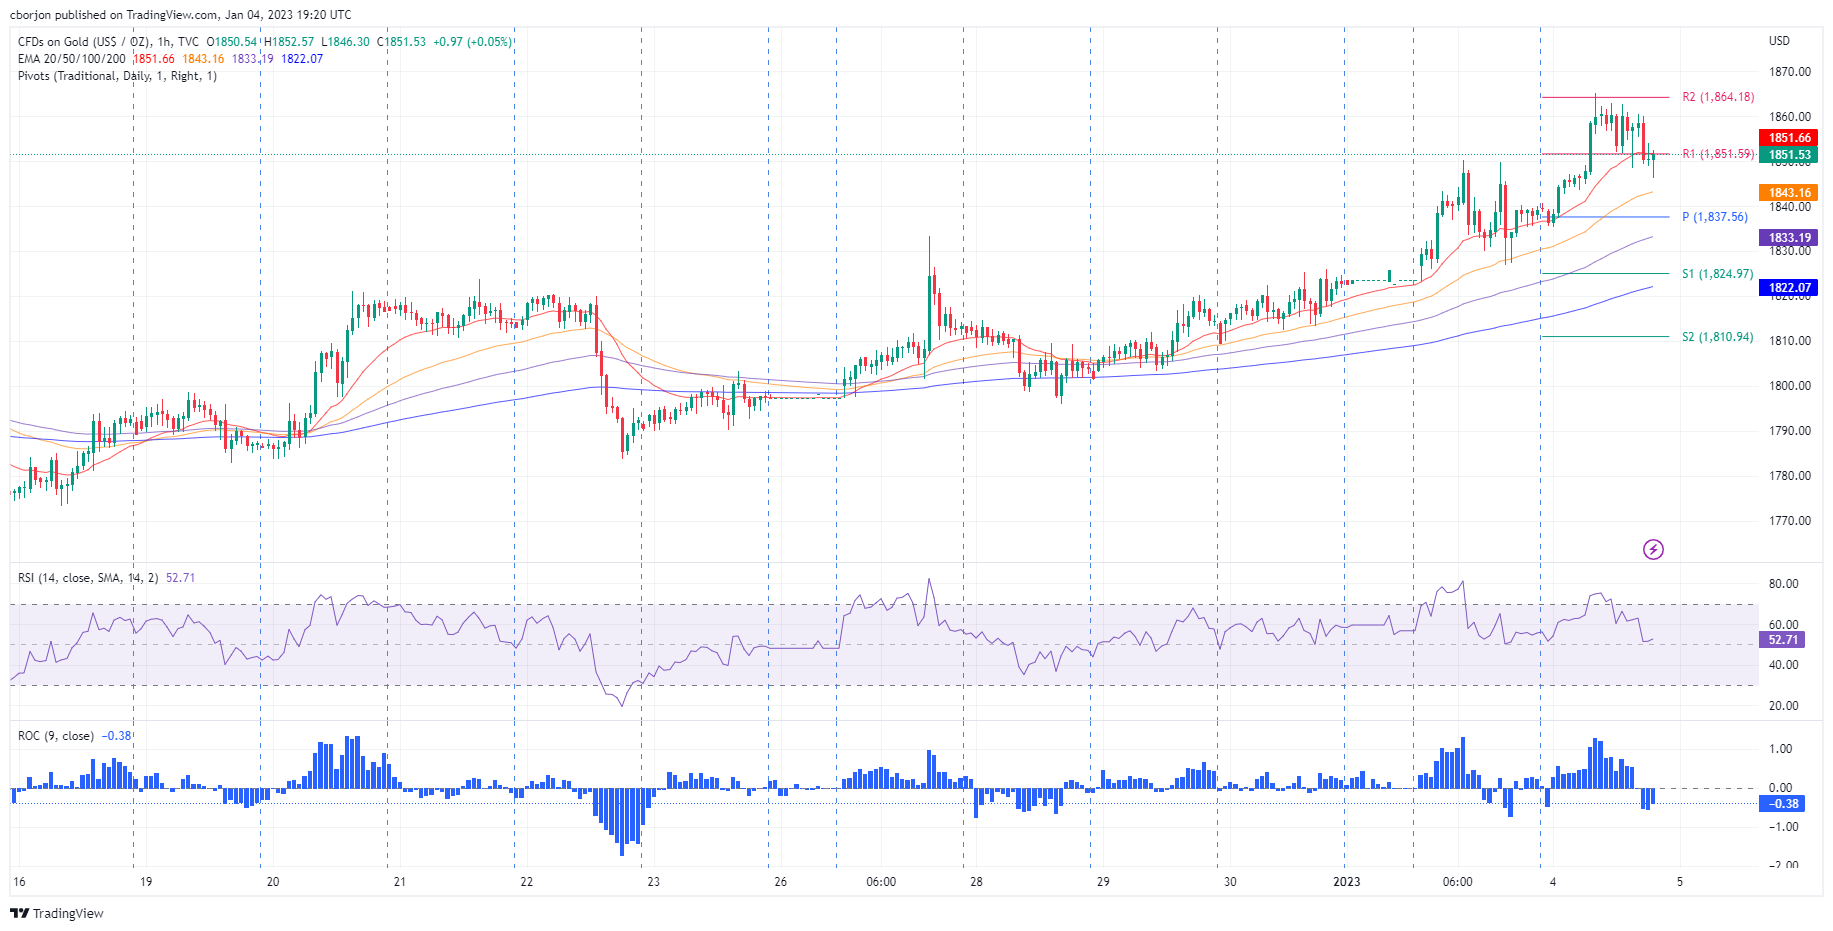
The US Dollar Index (DXY) headed towards 104.409 but retraced some of its gains. The XAU/USD slumped below $1,850, extending its drop towards $1,843, though, at the time of typing, it seesaws around the $1,850 figure.
Regarding US Treasury bond yields, which play a big part in XAU/USD’s direction, the 10-year benchmark note rate sits at 3.709%, falling three and a half bps during the day. Therefore, if XAU/USD holds to gains above $1,850, that could pave the way for a test of $1,900.
Gold Hourly Chart
Information on these pages contains forward-looking statements that involve risks and uncertainties. Markets and instruments profiled on this page are for informational purposes only and should not in any way come across as a recommendation to buy or sell in these assets. You should do your own thorough research before making any investment decisions. FXStreet does not in any way guarantee that this information is free from mistakes, errors, or material misstatements. It also does not guarantee that this information is of a timely nature. Investing in Open Markets involves a great deal of risk, including the loss of all or a portion of your investment, as well as emotional distress. All risks, losses and costs associated with investing, including total loss of principal, are your responsibility. The views and opinions expressed in this article are those of the authors and do not necessarily reflect the official policy or position of FXStreet nor its advertisers.