Gold Price Forecast: XAU/USD corrects to near $1,740 as DXY advances, US Durable Goods Orders eyed
|
- Gold price has slipped to near $1,740 as the DXY has recovered a majority of Tuesday’s losses.
- The US private sector has contracted sharply led by higher velocity in hiking interest rates by the Fed.
- The US Durable Goods Orders data is seen lower at 0.6% than the former release of 2%.
Gold price (XAU/USD) is going through a corrective mode after failing to sustain above the critical hurdle of $1,750.00. The precious metal has witnessed a short-live correction as the US dollar index (DXY) has managed to recover more than half of its entire losses recorded on Tuesday after the release of the downbeat US Purchasing Managers Index (PMI). The DXY has climbed to near 108.80 after printing a low of 108.36.
The downbeat US PMI is the consequence of the adaptation of a higher pace in hiking interest rates by the Federal Reserve (Fed). Activities of the private sector are contracting dramatically led by the unavailability of cheap money for investment in multiple projects. Lack of liquidity due to higher interest rates has forced them to go with ultra-filtered investments only. Also, the corporate sector is not operating at full production capacities amid expectations of a decline in the overall demand ahead.
In today’s session, the US Durable Goods Orders will hog the limelight. According to the market consensus, the economic data is likely to land at 0.6%, lower than the prior release of 2%. As price pressures are higher in the US economy and the value of paychecks for households is trimming sharply, investors have surrendered the demand for durable goods for a while.
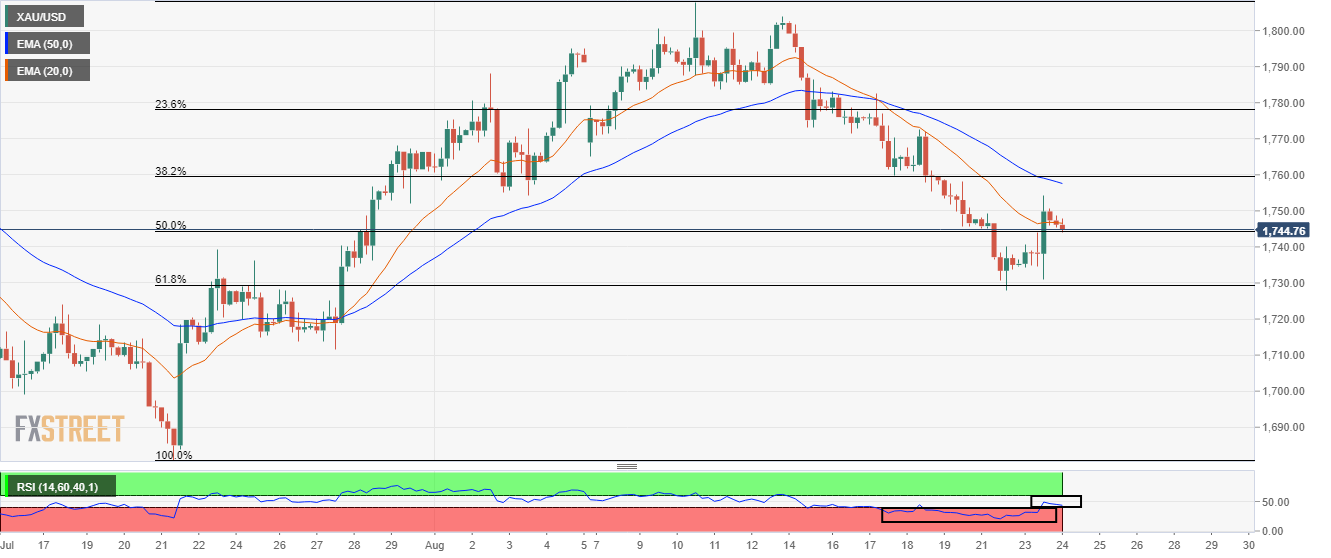
Gold technical analysis
Gold prices are attempting to sustain above the 50% Fibonacci retracement (placed from July 21 low at $1,680.91 to August 10 high at $1,807.93) at $1,744.42. The precious metal is dealing with the 20-period Exponential Moving Average (EMA) at $1,746.64 for now. However, the 50-EMA at $1,757.70 is still declining.
Meanwhile, the Relative Strength Index (RSI) (14) has shifted into the neutral range of 40.00-60.00 from the bearish range of 20.00-40.00. But that doesn’t warrant that the impact of bears has faded.
Gold four-hour chart
Information on these pages contains forward-looking statements that involve risks and uncertainties. Markets and instruments profiled on this page are for informational purposes only and should not in any way come across as a recommendation to buy or sell in these assets. You should do your own thorough research before making any investment decisions. FXStreet does not in any way guarantee that this information is free from mistakes, errors, or material misstatements. It also does not guarantee that this information is of a timely nature. Investing in Open Markets involves a great deal of risk, including the loss of all or a portion of your investment, as well as emotional distress. All risks, losses and costs associated with investing, including total loss of principal, are your responsibility. The views and opinions expressed in this article are those of the authors and do not necessarily reflect the official policy or position of FXStreet nor its advertisers.