Gold Price Forecast: XAU/USD builds cushion around $1,650 as yields set to bleed further
|
- Gold price is forming a base of around $1,650.00 for a fresh rebound amid a joyful market mood.
- Yields have dropped to near 4.10% and are making way for more downside amid S&P 500’s bullish bets.
- Households have dropped their plans of buying new houses due to accelerating interest obligations.
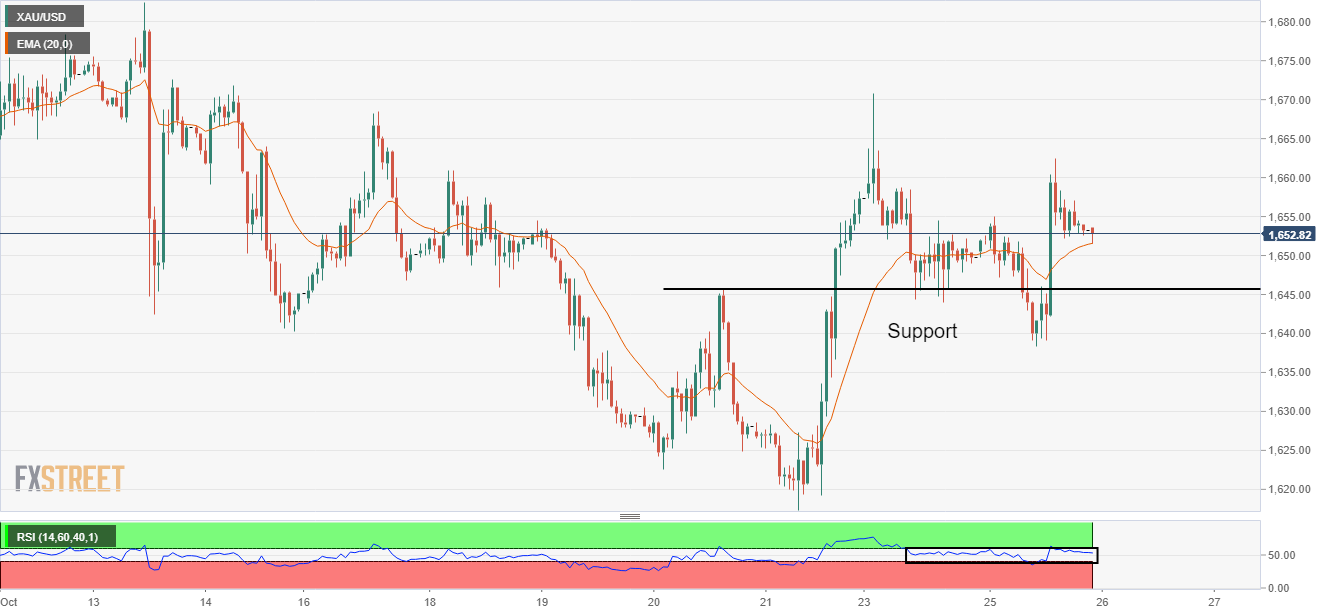
Gold price (XAU/USD) is building a base around the critical support of $1,650.00 after correcting from Tuesday’s high at $1,662.45. The precious metal could resume its upside journey as the spirits of market participants are highly optimistic.
A third consecutive bullish settlement of the S&P500 has brought a sense of optimism to the market. On the contrary, alpha on US Treasuries has dropped sharply and may display more decline ahead as optimism will stay for longer. In the opinion of economists at Morgan Stanley, the rally in S&P500 could be extended well into the 4000/4150 area.
This indicates that the market mood will remain cheerful, which could have a devastating impact on yields. At the press time, the 10-year US Treasury yields are trading at 4.10% and could surrender the cushion of 4.0% ahead as clouds of uncertainty are fading away.
Meanwhile, the US dollar index (DXY) has been dragged to 110.75 as the appeal for a safe haven has trimmed significantly. The New Home Sales data will be a major trigger in today's session. The economic data is seen lower at 0.585M vs. the prior release of 0.685M on a monthly basis. Accelerating interest rates have resulted in higher installment obligations for households, forcing them to postpone their demand for a new house.
Gold technical analysis
On an hourly scale, gold prices have bounced back sharply after dropping below the horizontal support placed from Thursday’s high at $1,640.55. The precious metal is expected to display a sideways movement ahead as the Relative Strength Index (RSI) (14) has shifted into the 40.00-60.00 range. The 20-period Exponential Moving Average (EMA) near $1,651.50 is acting as major support for the counter.
Gold hourly chart
Information on these pages contains forward-looking statements that involve risks and uncertainties. Markets and instruments profiled on this page are for informational purposes only and should not in any way come across as a recommendation to buy or sell in these assets. You should do your own thorough research before making any investment decisions. FXStreet does not in any way guarantee that this information is free from mistakes, errors, or material misstatements. It also does not guarantee that this information is of a timely nature. Investing in Open Markets involves a great deal of risk, including the loss of all or a portion of your investment, as well as emotional distress. All risks, losses and costs associated with investing, including total loss of principal, are your responsibility. The views and opinions expressed in this article are those of the authors and do not necessarily reflect the official policy or position of FXStreet nor its advertisers.
