Gold Price Forecast: XAU/USD accelerates to near $1,930 despite upbeat hawkish Fed bets
|
- Gold price has jumped to $1,930.00 amid mixed views about Fed’s interest rate guidance.
- Investors would keep an eye on the FOMC minutes and the US Employment data.
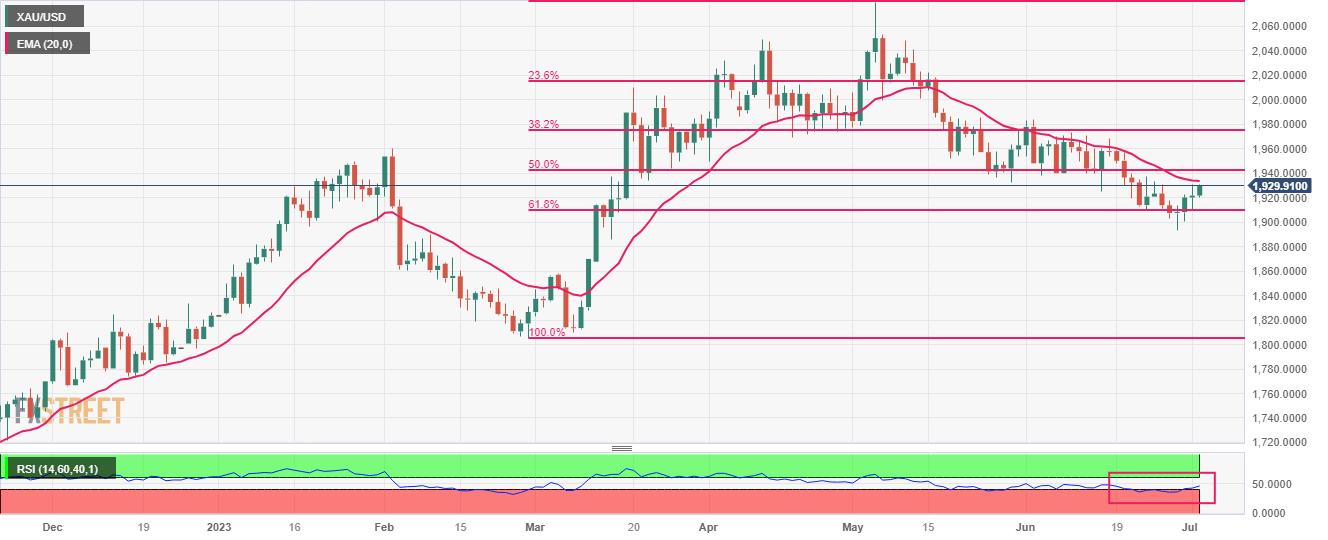
- Gold price has rebounded from near the 61.8% Fibonacci retracement at $1,909.55.
Gold price (XAU/USD) has climbed to near $1,930.00 in the European session. The precious metal has delivered a stellar rally despite investors are anticipating a small interest rate hike by the Federal Reserve (Fed) in its July monetary policy.
S&P500 futures are holding nominal losses in London amid caution among investors ahead of second-quarter result season. The risk profile is quiet as investors are expected to deliver irrational moves once United States companies would start disclosing quarterly performance.
The US Dollar Index (DXY) is showing choppy moves around 103.00 amid mixed views about July’s interest rate decision. Fed chair Jerome Powell has already cleared that two small interest rate hikes are appropriate by year-end. While Atlanta Fed Bank President Raphael Bostic stated last week that the central bank has reached a point where interest rates are sufficiently restrictive to bring down inflation to 2%.
Going forward, investors would keep an eye on Federal Open Market Committee (FOMC) minutes. The minutes will provide a detailed explanation behind a steady interest rate policy announcement. Apart from that, cues about further interest rates and economic prospects will be keenly watched.
In addition to FOMC minutes, investors would await Automatic Data Processing (ADP) Employment data. As per the estimates, the US economy added 180K fresh payrolls in June lower than the addition of 278K made in May.
Gold technical analysis
Gold price has rebounded from near the 61.8% Fibonacci retracement (plotted from February 28 low at $1,804.76 to May 03 high at $2,079.76) at $1,909.55 on a daily scale. The 20-period daily Exponential Moving Average (EMA) at $1,933.54 is still acting as a barricade for the Gold bulls.
Meanwhile, the Relative Strength Index (RSI) (14) has jumped into the 40.00-60.00 range from the bearish range of 20.00-40.00, which indicates that the downside momentum has faded. Investors should note that the downside bias is still solid
Gold daily chart
Information on these pages contains forward-looking statements that involve risks and uncertainties. Markets and instruments profiled on this page are for informational purposes only and should not in any way come across as a recommendation to buy or sell in these assets. You should do your own thorough research before making any investment decisions. FXStreet does not in any way guarantee that this information is free from mistakes, errors, or material misstatements. It also does not guarantee that this information is of a timely nature. Investing in Open Markets involves a great deal of risk, including the loss of all or a portion of your investment, as well as emotional distress. All risks, losses and costs associated with investing, including total loss of principal, are your responsibility. The views and opinions expressed in this article are those of the authors and do not necessarily reflect the official policy or position of FXStreet nor its advertisers.
