Gold Price Analysis: XAU/USD’s bearish bias intact while below 200-DMA
|
- XAU/USD’s upside attempts remain capped by 200-DMA
- Technical set up on the daily chart favors the bears.
- Focus remains on US data, stimulus and vaccine news.
Gold (XAU/USD) fails to resist above the $1850 level once again, as sellers return in early European trading.
Despite the latest leg down, gold prices remain in a familiar range of around $1840-45 levels, awaiting fresh impetus from the US economic data.
The US dollar clings onto its recovery gains across its main rivals, as the risk-off action in the US stock futures weighs on the market mood amid ongoing Wall Street speculative trades and vaccine concerns.
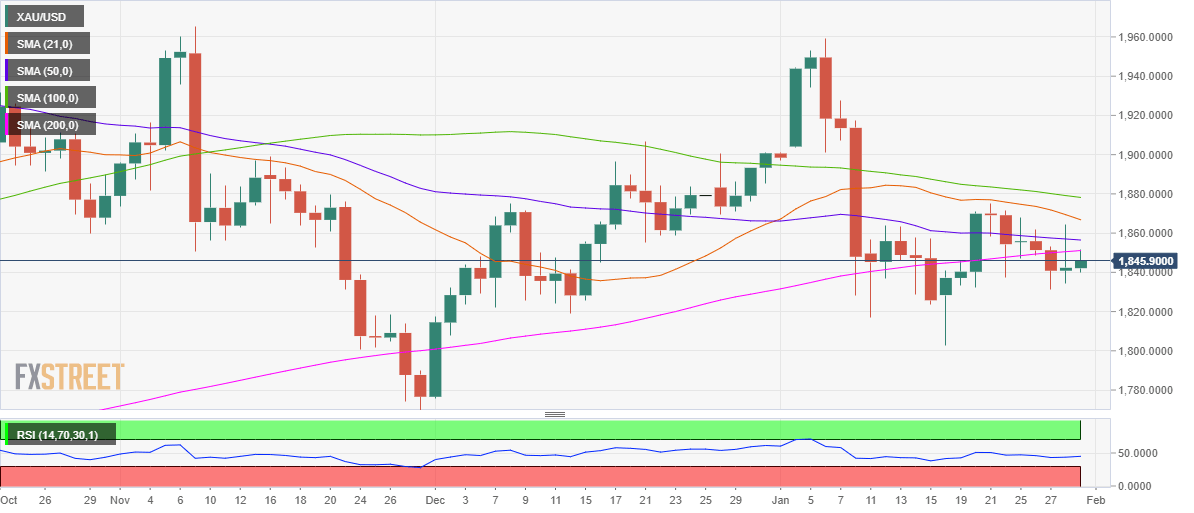
Gold Price Chart: Daily

From a technical perspective, the XAU bears remain hopeful so long as the price makes a sustained move above the critical 200-daily moving average (DMA), now at $1851.
Gold bulls have failed to find acceptance above the latter over the past six trading sessions, leaving the downside risks intact in the metal.
Therefore, Thursday’s low of $1834 could be challenged en route the January 13 low at $1803. The Relative Strength Index (RSI) edges higher but remains the midline, backing the case for the sellers.
Alternatively, 50-DMA at $1857 could test the bulls’ commitment.
Gold Additional levels
Information on these pages contains forward-looking statements that involve risks and uncertainties. Markets and instruments profiled on this page are for informational purposes only and should not in any way come across as a recommendation to buy or sell in these assets. You should do your own thorough research before making any investment decisions. FXStreet does not in any way guarantee that this information is free from mistakes, errors, or material misstatements. It also does not guarantee that this information is of a timely nature. Investing in Open Markets involves a great deal of risk, including the loss of all or a portion of your investment, as well as emotional distress. All risks, losses and costs associated with investing, including total loss of principal, are your responsibility. The views and opinions expressed in this article are those of the authors and do not necessarily reflect the official policy or position of FXStreet nor its advertisers.