Gold Price Analysis: XAU/USD wavers above $1,700 despite Friday’s Doji, oversold RSI probe bears
|
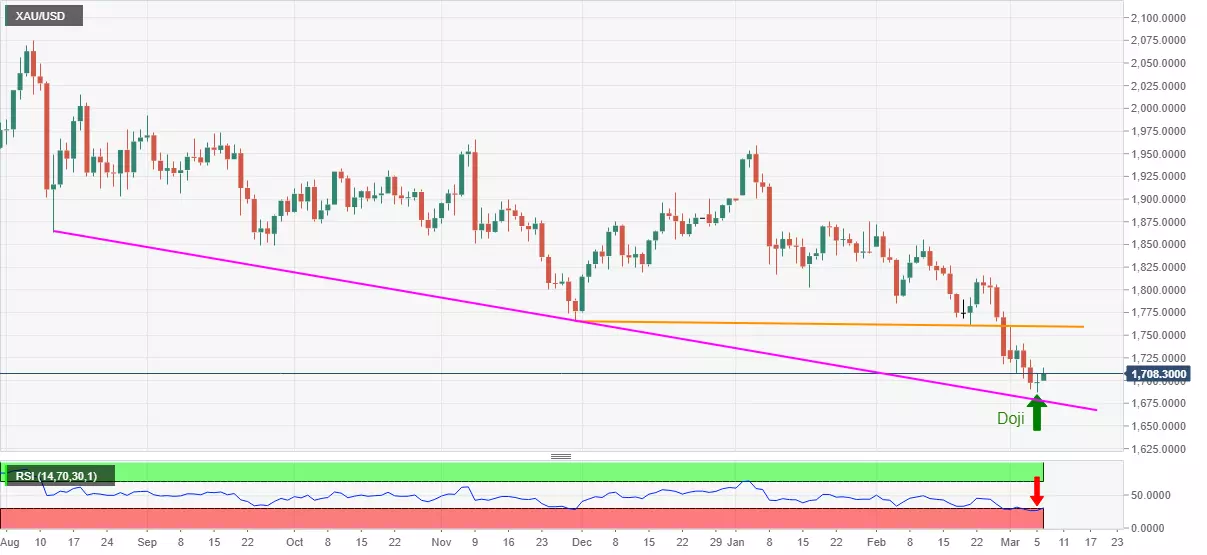
- Gold prints the heaviest gains in a week after candlestick formation, RSI conditions favor corrective pullback.
- Bulls have a long way to go before convincing markets, seven-month-old support line lure bears.
Gold prices pick up bids near $1,708, up 0.57% intraday, while heading into Monday’s European session open. In doing so, the quote extends Friday’s bounce off the nine-month low.
Given the oversold RSI conditions joining hands with Friday’s Doji candlestick pattern, suggesting a trend reversal, gold is up for a further corrective pullback.
However, a descending trend line from November 30, at $1,760 now, will be a tough nut to crack for gold buyers.
Meanwhile, the $1,700 threshold can offer immediate support before directing gold sellers towards a descending trend line from August 12, 2020, at $1,677 now.
If at all gold sellers aren’t tired below $1,677, June 2020 low near $1,670 and January 2020 peak surrounding $1,610 should return to the chart.
To sum up, gold needs to convince buyers but short-term bounce can’t be ruled out.
Gold daily chart
Trend: Further recovery expected
Information on these pages contains forward-looking statements that involve risks and uncertainties. Markets and instruments profiled on this page are for informational purposes only and should not in any way come across as a recommendation to buy or sell in these assets. You should do your own thorough research before making any investment decisions. FXStreet does not in any way guarantee that this information is free from mistakes, errors, or material misstatements. It also does not guarantee that this information is of a timely nature. Investing in Open Markets involves a great deal of risk, including the loss of all or a portion of your investment, as well as emotional distress. All risks, losses and costs associated with investing, including total loss of principal, are your responsibility. The views and opinions expressed in this article are those of the authors and do not necessarily reflect the official policy or position of FXStreet nor its advertisers.