Gold Miners Junior ETF (GDXJ) has resumed the rally higher
|
The VanEck Junior Gold Miners ETF (GDXJ) tracks small- and mid-cap gold and silver mining companies. Launched in 2009, it invests heavily in firms earning most of their revenue from mining or related activities. It appeals to investors seeking high-risk, high-reward exposure to precious metals. Below we will look at the Elliott Wave outlook of the ETF.
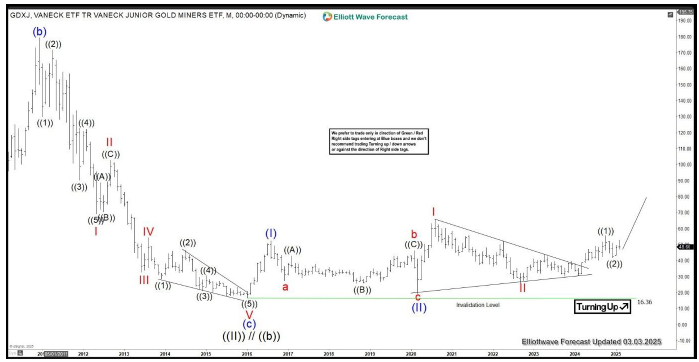
GDXJ monthly Elliott Wave view
Monthly Elliott Wave Chart of GDXJ shows that the ETF made major low in 2016 at 16.36. We labelled this major bottom as wave ((II)). From there, the ETF rallied higher as a nest. Up from wave ((II), wave (I) ended at 52.5 and pullback in wave (II) ended at 19.52. The ETF nested higher in wave I at 65.95 and pullback in wave II ended at 25.8. Near term, while above 16.36, expect the ETF to extend higher.
GDXJ daily Elliott Wave view
Daily Elliott Wave Chart of GDXJ shows dips to 25.79 ended wave II. The ETF then turned higher in wave III with internal subdivision as a 5 waves. Up from wave II, wave (1) ended at 41.16, and pullback in wave (2) ended at 30.46. The ETF resumed higher in wave (3) towards 49.13 and pullback in wave (4) ended at 40.26. Final leg wave (5) ended at 55.58 which completed wave ((1)) in higher degree. Pullback in wave ((2)) ended at 41.85 but the ETF needs to break above wave ((1)) to confirm the next leg higher has tarted. Near term, while above 25.75, expect the ETF to extend higher.
GDXJ four hour Elliott Wave view
4 Hour Elliott Wave Chart of Gold Miners Junior ETF (GDXJ) above shows that cycle from 9.26.2022 low ended at 55.62 as wave ((1)). Pullback in wave ((2)) unfolded as a zigzag Elliott Wave structure. Down from wave ((1)), wave (A) ended at 44.11 and wave (B) ended at 51.03. Wave (C) lower ended at 41.88 which completed wave ((2)). The ETF has turned higher in wave ((3)). Up from wave ((2)), wave 1 ended at 53.05 and pullback in wave 2 ended at 47.29. Near term, while above 41.88, expect the ETF to extend higher.
GDXJ Elliott Wave video
Information on these pages contains forward-looking statements that involve risks and uncertainties. Markets and instruments profiled on this page are for informational purposes only and should not in any way come across as a recommendation to buy or sell in these assets. You should do your own thorough research before making any investment decisions. FXStreet does not in any way guarantee that this information is free from mistakes, errors, or material misstatements. It also does not guarantee that this information is of a timely nature. Investing in Open Markets involves a great deal of risk, including the loss of all or a portion of your investment, as well as emotional distress. All risks, losses and costs associated with investing, including total loss of principal, are your responsibility. The views and opinions expressed in this article are those of the authors and do not necessarily reflect the official policy or position of FXStreet nor its advertisers.

