GBPJPY Price Analysis: Rallies more than 200-pips as risk-aversion fades
|
- GBPJPY registers gains of more than 1.30%, as buyers eye 170.00.
- The divergence between the GBPJPY price action and the RSI could exacerbate a correction before resuming the uptrend.
- Near term, if the GBPJPY fails to achieve a daily close above 168.90, it could open the door for further downside.
The GBPJPY stages a recovery trimming some of the last week’s losses as market sentiment improves during Monday’s Wall Street session. Factors like US midterm elections and also a mixed US jobs report opened the door for gradual tightening by the Federal Reserve, after hiking four times, 75 bps, for a total of 300 bps in the last meetings, in a period of stubbornly high inflation. At the time of writing, the GBPJPY is trading at 169.06.
GBPJPY Price Analysis: Technical outlook
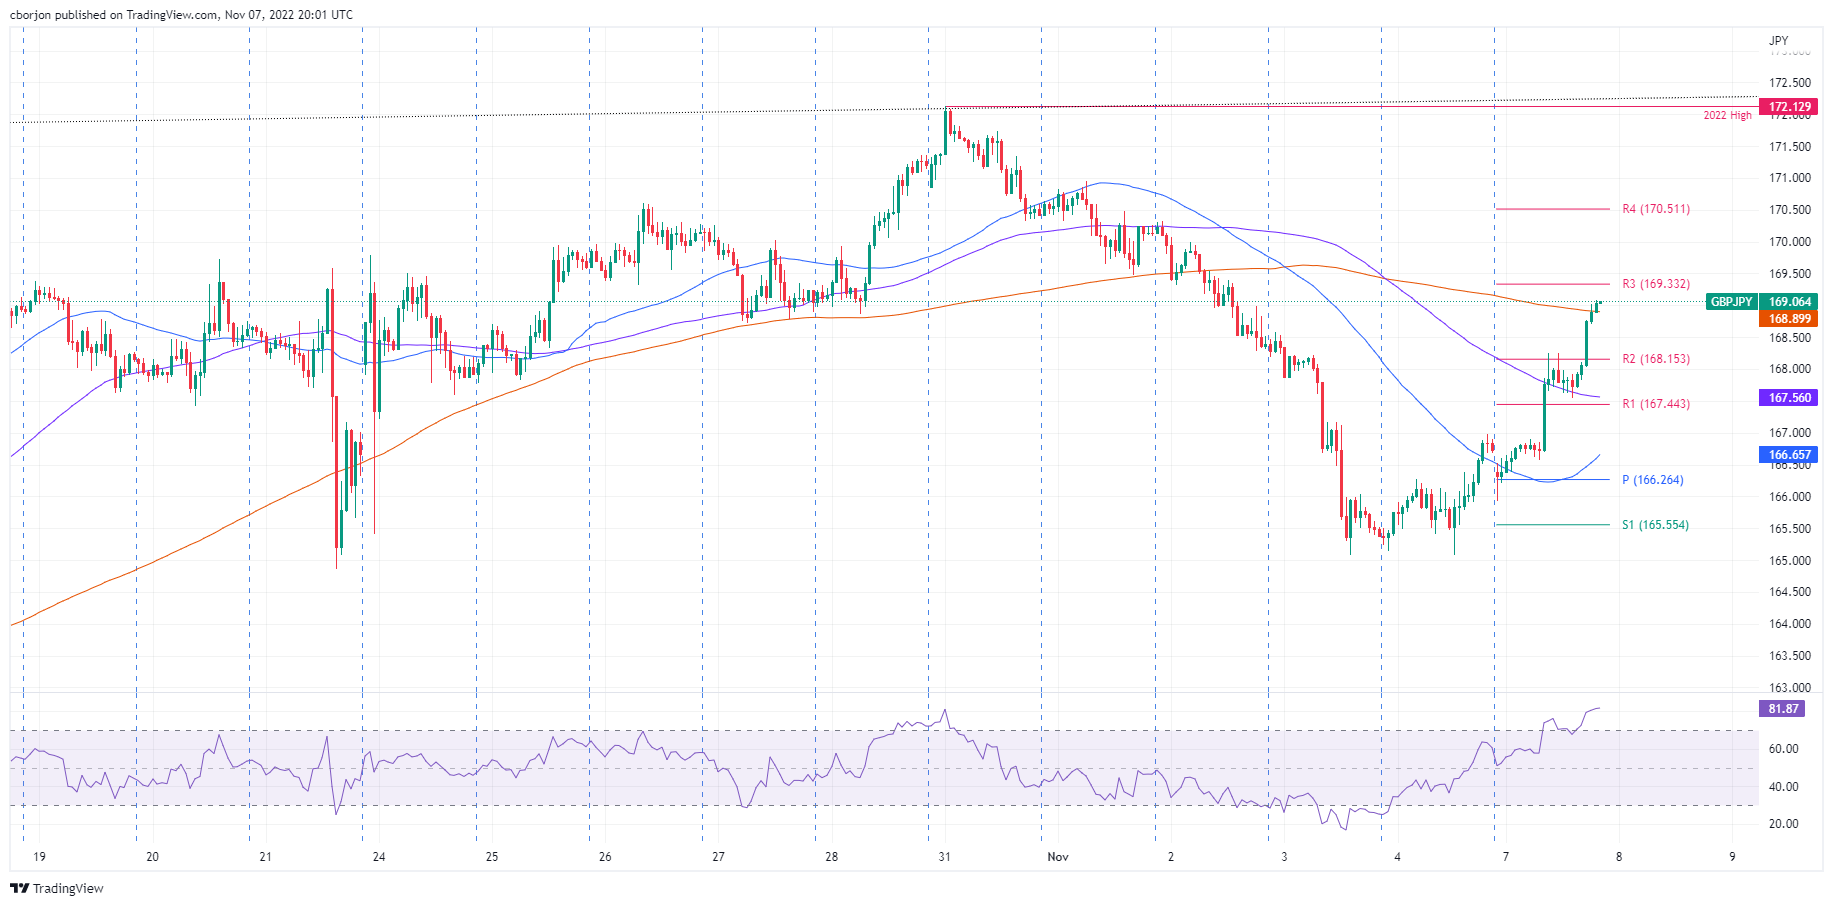
The GBPJPY depicts the pair as upward biased, eyeing a test of the 170.00 figure, which could exacerbate a rally towards the YTD high reached on October 31 at 172.13. Nevertheless, GBP buyers should be aware that the Relative Strength Index (RSI) at 55.88, albeit in bullish territory, failed to clear the previous peaks as GBPJPY price action did. So a negative divergence could form if the GBPJPY breaks toward new YTD highs, suggesting a pullback is on the cards.
Short term, the GBPJPY hourly chart depicts the pair trades above the 200-hour EMA at 168.90, suggesting that buyers are gathering momentum. Still, unless they achieve a daily close above it, the cross-currency would be vulnerable to selling pressure. Of note, the Relative Strength Index (RSI) at 81.70 portrays the pair as overbought, which could exacerbate a correction lower.
Hence, the GBPJPY first support would be the R2 daily pivot at 168,15, followed by the confluence of the R1 daily pivot and the 100-hour EMA at 167.44 and 167.56, respectively, followed by the 167.00 figure.
GBPJPY Key Technical Levels
Information on these pages contains forward-looking statements that involve risks and uncertainties. Markets and instruments profiled on this page are for informational purposes only and should not in any way come across as a recommendation to buy or sell in these assets. You should do your own thorough research before making any investment decisions. FXStreet does not in any way guarantee that this information is free from mistakes, errors, or material misstatements. It also does not guarantee that this information is of a timely nature. Investing in Open Markets involves a great deal of risk, including the loss of all or a portion of your investment, as well as emotional distress. All risks, losses and costs associated with investing, including total loss of principal, are your responsibility. The views and opinions expressed in this article are those of the authors and do not necessarily reflect the official policy or position of FXStreet nor its advertisers.