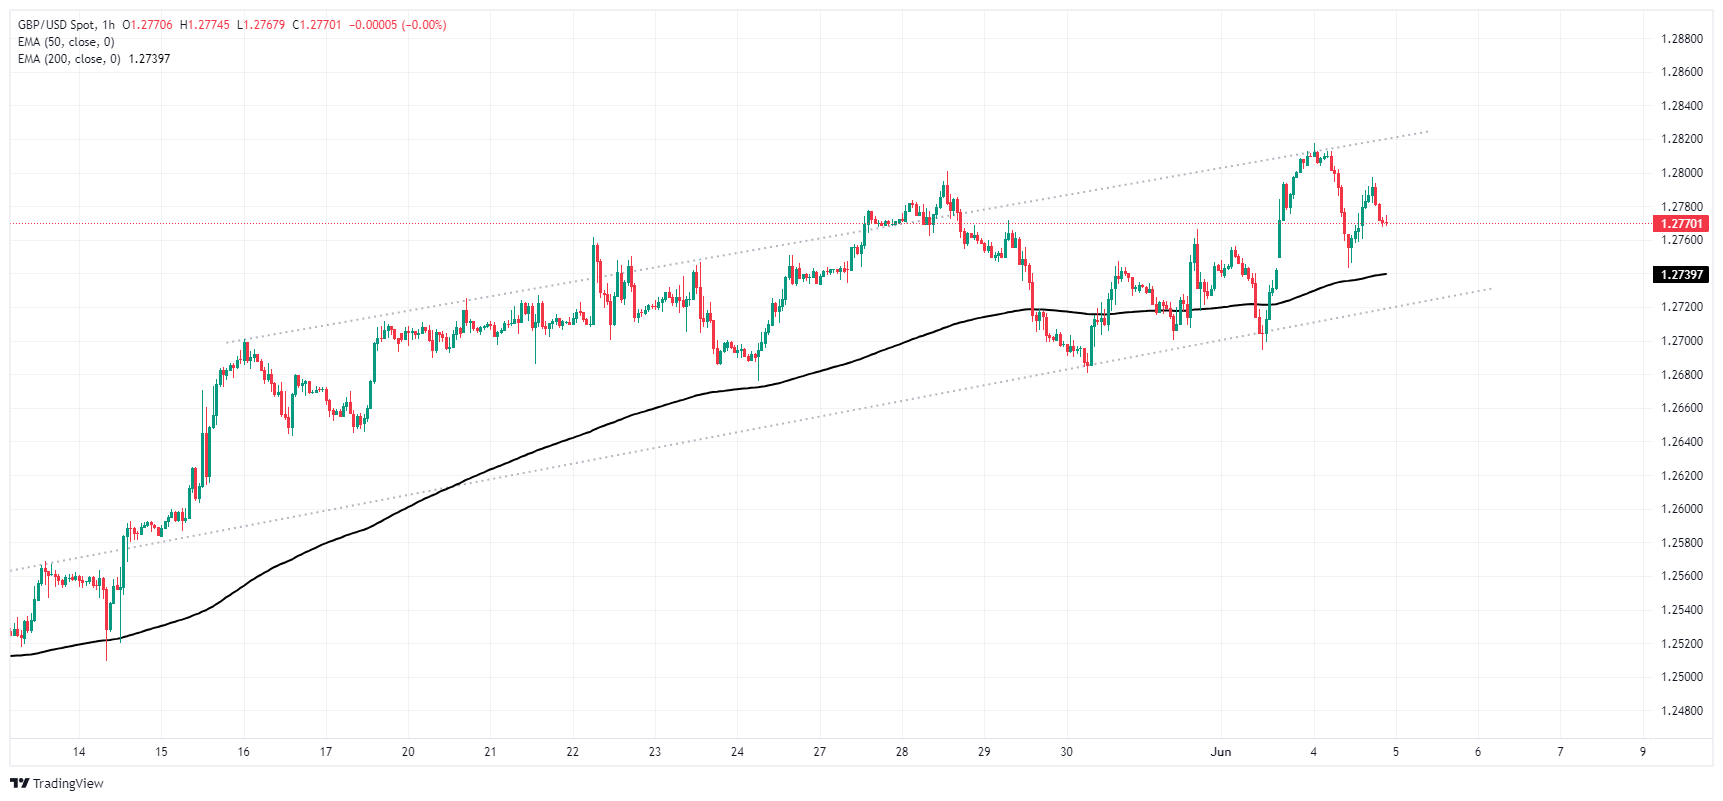
GBP/USD trades below 1.2800 after safe haven flows bolster Greenback
|
- GBP/USD declined 0.3% on Tuesday after risk-off USD bids.
- Softening UK data mixes poorly with declining Fed rate cut hopes.
- US markets set to pivot to key US labor data ahead of Friday’s NFP.
GBP/USD shed a third of a percent through Tuesday’s trading, falling below 1.2800 after short-lived bullish momentum carried the pair into its highest bids since mid-March. The Cable is falling back after three straight bullish days, and market sentiment is broadly pivoting into Greenback bids as hopes for a Federal Reserve (Fed) rate cut get pushed out to November.
UK BRC Like-For-Like Retail Sales grew less than expected for the year ended in May, printing at 0.4% YoY compared to the forecast 1.2%. UK retail sales data is struggling to recover from the previous period’s -4.4% decline. On the US side, JOLTS Job Opening in April eased to 8.059 million, down from the previous revised 8.355 million and missing the forecast 8.34 million. With a still-tight job market plaguing broad-market hopes for rate cuts, risk sentiment soured on the data miss.
The economic calendar remains thin through the remainder of the week, leaving investors to face further labor figures from the US with ADP Employment Change figures on Wednesday and another batch of monthly US Nonfarm Payrolls (NFP) figures on Friday. ADP’s Employment Change in May is forecast to ease to 173K from the previous 192K, while Friday’s NFP is expected to bounce to 190K from the previous 175K.
GBP/USD technical outlook
GBP/USD has fallen back from near-term highs above the 1.2800 handle, and is set for a rough decline to the lower bound of a choppy rising channel. The bottom could potentially get priced in between 1.2720 and 1.2740, though long-term bullish pressure will look for an extended rebound from the 200-day Exponential Moving Average (EMA) at 1.2739.
Bulls will have their work cut out for them with daily candlesticks set to tumble out of the bottom end of a heavy supply zone below 1.2900, and the immediate price floor for short momentum sits at the 200-day EMA at 1.2580.
GBP/USD hourly chart

GBP/USD daily chart
Information on these pages contains forward-looking statements that involve risks and uncertainties. Markets and instruments profiled on this page are for informational purposes only and should not in any way come across as a recommendation to buy or sell in these assets. You should do your own thorough research before making any investment decisions. FXStreet does not in any way guarantee that this information is free from mistakes, errors, or material misstatements. It also does not guarantee that this information is of a timely nature. Investing in Open Markets involves a great deal of risk, including the loss of all or a portion of your investment, as well as emotional distress. All risks, losses and costs associated with investing, including total loss of principal, are your responsibility. The views and opinions expressed in this article are those of the authors and do not necessarily reflect the official policy or position of FXStreet nor its advertisers.