GBP/USD struggling to find gains above 1.2400 despite broad-market risk-on bids
|
- The GBP/USD is trading flat but rough on Friday, trying to hold above the 1.2400 handle.
- The Pound Sterling's midweek rally is still under threat as markets pare away gains.
- Slumping UK data is sending the GBP into consolidation.
The GBP/USD is treading water just above the 1.2400 handle as the pair grapples with the top end of recent consolidation. The Pound Sterling (GBP) is struggling to hold onto gains chalked in against the US Dollar (USD) this week.
The GBP peaked at a 2.25% gain against the US Dollar in the mid-week, and has since eased back to a more reasonable 1.65%.
Despite a broad-market risk bid fueled by the markets once again speculating that the Federal Reserve (Fed) is done with interest rate hikes, the GBP/USD is remaining trapped in the midrange as UK data misses the mark.
UK Retail Sales decline 0.3% MoM in October
UK Retail Sales declined month-on-month, with the October figure printing at -0.3%, reversing course on the market's forecast 0.3% increase. Losses on the tail end were the focus for investors however, with September's figure getting revised even lower from -0.9% to an eye-watering -1.1%.
Annualized UK Retail Sales fared even worse, with the year into October printing at -2.7% against the previous -1%, and accelerating past the forecast -1.5%.
Next week will see investors turning their attention towards the Fed's latest Meeting Minutes release on Tuesday.
GBP/USD Technical Outlook
The GBP/USD is in the green for the week, up 1.65% as the Pound Sterling holds onto what's left of the mid-week gains.
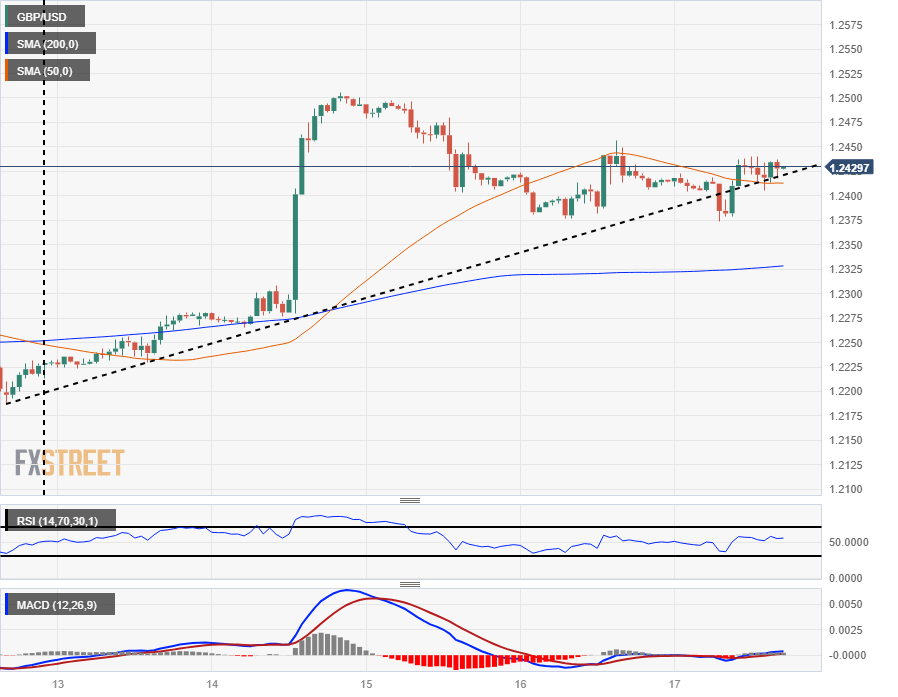
A near-term rising trendline from last week's lows near 1.2200 is still holding intraday action on the top side as hourly candles grapple with the 50-hour Simple Moving Average (SMA), but a flattening 200-hour SMA is set to continue drawing bids back into the median range.
Daily candlesticks have the GBP/USD strung up on the 200-day SMA as the pair struggles to develop fresh long-term momentum, and this week's peak at the 1.2500 handle represents the key figure for bullls to beat.
GBP/USD Hourly Chart
GBP/USD Technical Levels
Information on these pages contains forward-looking statements that involve risks and uncertainties. Markets and instruments profiled on this page are for informational purposes only and should not in any way come across as a recommendation to buy or sell in these assets. You should do your own thorough research before making any investment decisions. FXStreet does not in any way guarantee that this information is free from mistakes, errors, or material misstatements. It also does not guarantee that this information is of a timely nature. Investing in Open Markets involves a great deal of risk, including the loss of all or a portion of your investment, as well as emotional distress. All risks, losses and costs associated with investing, including total loss of principal, are your responsibility. The views and opinions expressed in this article are those of the authors and do not necessarily reflect the official policy or position of FXStreet nor its advertisers.