GBP/USD Price Forecast: Tests nine-day EMA barrier near 1.2950 amid a bullish bias
|
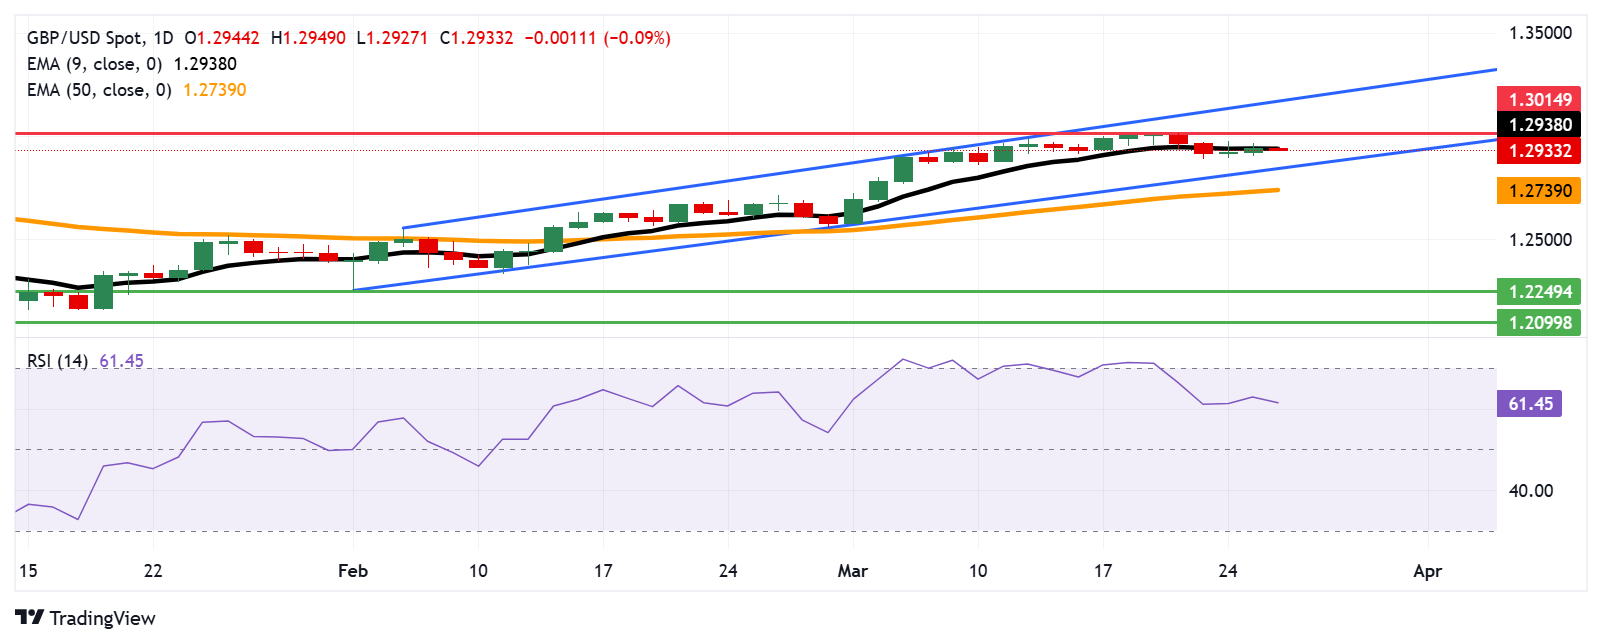
- GBP/USD tests immediate barrier at nine-day EMA at 1.2938 level.
- The 14-day RSI reinforces strong bullish momentum as it stays above the 50 mark.
- The primary support appears at the ascending channel’s lower boundary near 1.2840.
The GBP/USD pair loses ground after registering gains in the previous two sessions, trading around 1.2930 during the Asian hours on Wednesday. The technical analysis of the daily chart indicates a continued bullish bias, with the pair consolidating within an ascending channel pattern.
The 14-day Relative Strength Index (RSI) is positioned above 50, reinforcing strong bullish momentum. However, the GBP/USD pair has broken below the nine-day Exponential Moving Average (EMA), suggesting a bearish shift in the short-term price momentum.
The GBP/USD pair is testing an immediate barrier at the nine-day EMA at the 1.2938 level. A rebound above this level could revive the short-term price momentum, followed by the four-month high at 1.3014, recorded on March 20. Further advancement could reinforce the bullish bias and support the pair to test the ascending channel’s upper boundary near 1.3170.
On the downside, the GBP/USD pair is likely to navigate the region around the ascending channel’s lower boundary near 1.2840, followed by the 50-day EMA at 1.2739. A break below this level could weaken the medium-term price momentum and put downward pressure on the pair to depreciate toward a two-month low at the 1.2249 level, which was recorded on February 3.
GBP/USD: Daily Chart
British Pound PRICE Today
The table below shows the percentage change of British Pound (GBP) against listed major currencies today. British Pound was the weakest against the New Zealand Dollar.
| USD | EUR | GBP | JPY | CAD | AUD | NZD | CHF | |
|---|---|---|---|---|---|---|---|---|
| USD | 0.07% | 0.10% | 0.41% | -0.00% | -0.04% | -0.18% | 0.10% | |
| EUR | -0.07% | 0.03% | 0.31% | -0.08% | -0.10% | -0.25% | 0.03% | |
| GBP | -0.10% | -0.03% | 0.31% | -0.10% | -0.12% | -0.28% | 0.04% | |
| JPY | -0.41% | -0.31% | -0.31% | -0.40% | -0.45% | -0.58% | -0.28% | |
| CAD | 0.00% | 0.08% | 0.10% | 0.40% | 0.00% | -0.18% | 0.14% | |
| AUD | 0.04% | 0.10% | 0.12% | 0.45% | 0.00% | -0.15% | 0.16% | |
| NZD | 0.18% | 0.25% | 0.28% | 0.58% | 0.18% | 0.15% | 0.30% | |
| CHF | -0.10% | -0.03% | -0.04% | 0.28% | -0.14% | -0.16% | -0.30% |
The heat map shows percentage changes of major currencies against each other. The base currency is picked from the left column, while the quote currency is picked from the top row. For example, if you pick the British Pound from the left column and move along the horizontal line to the US Dollar, the percentage change displayed in the box will represent GBP (base)/USD (quote).
Information on these pages contains forward-looking statements that involve risks and uncertainties. Markets and instruments profiled on this page are for informational purposes only and should not in any way come across as a recommendation to buy or sell in these assets. You should do your own thorough research before making any investment decisions. FXStreet does not in any way guarantee that this information is free from mistakes, errors, or material misstatements. It also does not guarantee that this information is of a timely nature. Investing in Open Markets involves a great deal of risk, including the loss of all or a portion of your investment, as well as emotional distress. All risks, losses and costs associated with investing, including total loss of principal, are your responsibility. The views and opinions expressed in this article are those of the authors and do not necessarily reflect the official policy or position of FXStreet nor its advertisers.