GBP/USD Price Forecast: Bears gather steam, push prices below 1.3100
|
- GBP/USD consolidates within the 1.3060-1.3140 range, with sellers maintaining control after last week's US jobs report boosted the Greenback.
- The pair is downward biased after falling below the 50-DMA, with key support at the September 11 low of 1.3001 and the 100-DMA at 1.2935.
- A break above 1.3100 could signal a reversal, with resistance at 1.3200, followed by the October 3 peak of 1.3269.
The British Pound lost some ground against the Greenback on Wednesday as traders await minutes of the Federal Reserve’s last meeting and US inflation data on Thursday. At the time of writing, the GBP/USD trades at 1.3070, below its opening price by 0.26%.
GBP/USD Price Forecast: Technical outlook
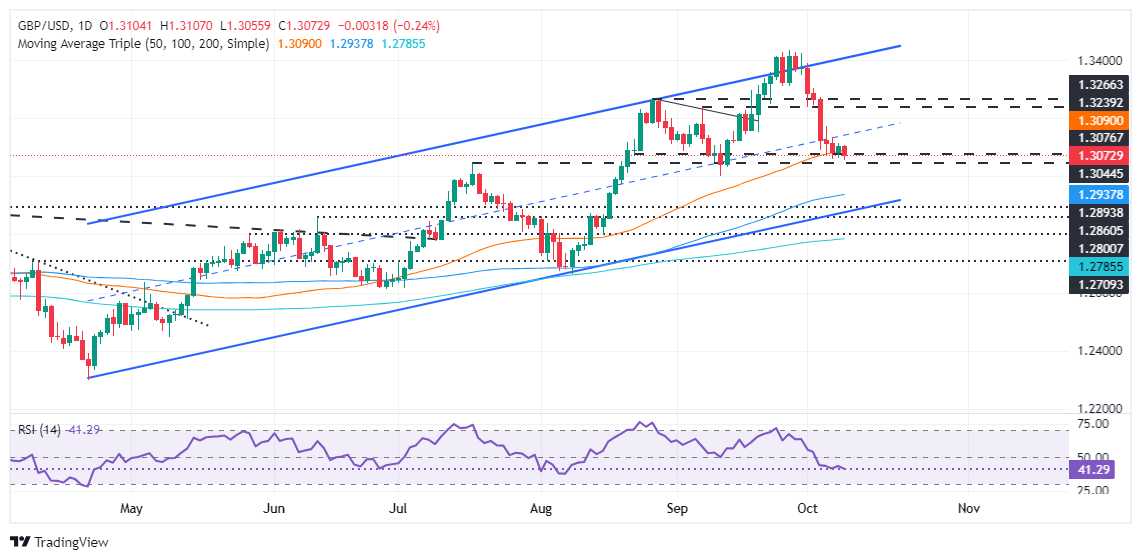
The GBP/USD has consolidated within the 1.3060-1.3140 range for the last three days. The lack of a catalyst keeps market players uncertain, though last week’s US jobs report boosted the Greenback, which reached levels last seen in August 2024.
Momentum hints that sellers are in charge, as portrayed by the bearish reading of the Relative Strength Index (RSI).
In the short term, the pair is downward biased. The drop below the 50-day moving average (DMA) at 1.3087 opened the door for further losses. However, if sellers want to remain in charge, they must drive the exchange rate to the September 11 swing low of 1.3001. If that level is cleared, the 100-DMA at 1.2935 would be up for grabs, followed by the 200-DMA at 1.2784.
Conversely, if GBP/USD reclaims 1.3100 and rallies above 1.3200, it would open the door for further upside. The next resistance would be October 3 peak at 1.3269, followed by the October 2 high at 1.3305.
GBP/USD Price Action – Daily Chart
British Pound PRICE Today
The table below shows the percentage change of British Pound (GBP) against listed major currencies today. British Pound was the strongest against the New Zealand Dollar.
| USD | EUR | GBP | JPY | CAD | AUD | NZD | CHF | |
|---|---|---|---|---|---|---|---|---|
| USD | 0.31% | 0.24% | 0.66% | 0.30% | 0.49% | 1.35% | 0.25% | |
| EUR | -0.31% | -0.08% | 0.33% | -0.04% | 0.22% | 0.99% | -0.08% | |
| GBP | -0.24% | 0.08% | 0.41% | 0.08% | 0.29% | 1.08% | -0.00% | |
| JPY | -0.66% | -0.33% | -0.41% | -0.33% | -0.14% | 0.69% | -0.42% | |
| CAD | -0.30% | 0.04% | -0.08% | 0.33% | 0.19% | 1.03% | -0.07% | |
| AUD | -0.49% | -0.22% | -0.29% | 0.14% | -0.19% | 0.81% | -0.29% | |
| NZD | -1.35% | -0.99% | -1.08% | -0.69% | -1.03% | -0.81% | -1.09% | |
| CHF | -0.25% | 0.08% | 0.00% | 0.42% | 0.07% | 0.29% | 1.09% |
The heat map shows percentage changes of major currencies against each other. The base currency is picked from the left column, while the quote currency is picked from the top row. For example, if you pick the British Pound from the left column and move along the horizontal line to the US Dollar, the percentage change displayed in the box will represent GBP (base)/USD (quote).
Information on these pages contains forward-looking statements that involve risks and uncertainties. Markets and instruments profiled on this page are for informational purposes only and should not in any way come across as a recommendation to buy or sell in these assets. You should do your own thorough research before making any investment decisions. FXStreet does not in any way guarantee that this information is free from mistakes, errors, or material misstatements. It also does not guarantee that this information is of a timely nature. Investing in Open Markets involves a great deal of risk, including the loss of all or a portion of your investment, as well as emotional distress. All risks, losses and costs associated with investing, including total loss of principal, are your responsibility. The views and opinions expressed in this article are those of the authors and do not necessarily reflect the official policy or position of FXStreet nor its advertisers.