GBP/USD Price Analysis: Remains depressed below 1.2800, downside potential seems limited
|
- GBP/USD drifts lower on Thursday amid the hawkish Fed-inspired USD buying interest.
- The mixed technical setup warrants some caution before positioning for deeper losses.
- A daily close above the 1.2800 mark will set the stage for a further appreciating move.
The GBP/USD pair edges lower during the Asian session on Thursday and retreats further from over a three-month top, around the 1.2860 region touched the previous day, in reaction to softer US consumer inflation figures. Spot prices, for now, seem to have snapped a three-day winning streak and currently trade around the 1.2785 area, down 0.10% for the day.
The US Dollar (USD) builds on the overnight bounce from the weekly low in the wake of the Federal Reserve's (Fed) hawkish surprise, indicating that fewer rate cuts were needed this year. Moreover, flash figures published on Wednesday showed that the UK economic growth stalled in April after the muted rebound from last year’s recession. This, in turn, is seen undermining the British Pound (GBP) and contributing to the offered tone surrounding the GBP/USD pair.
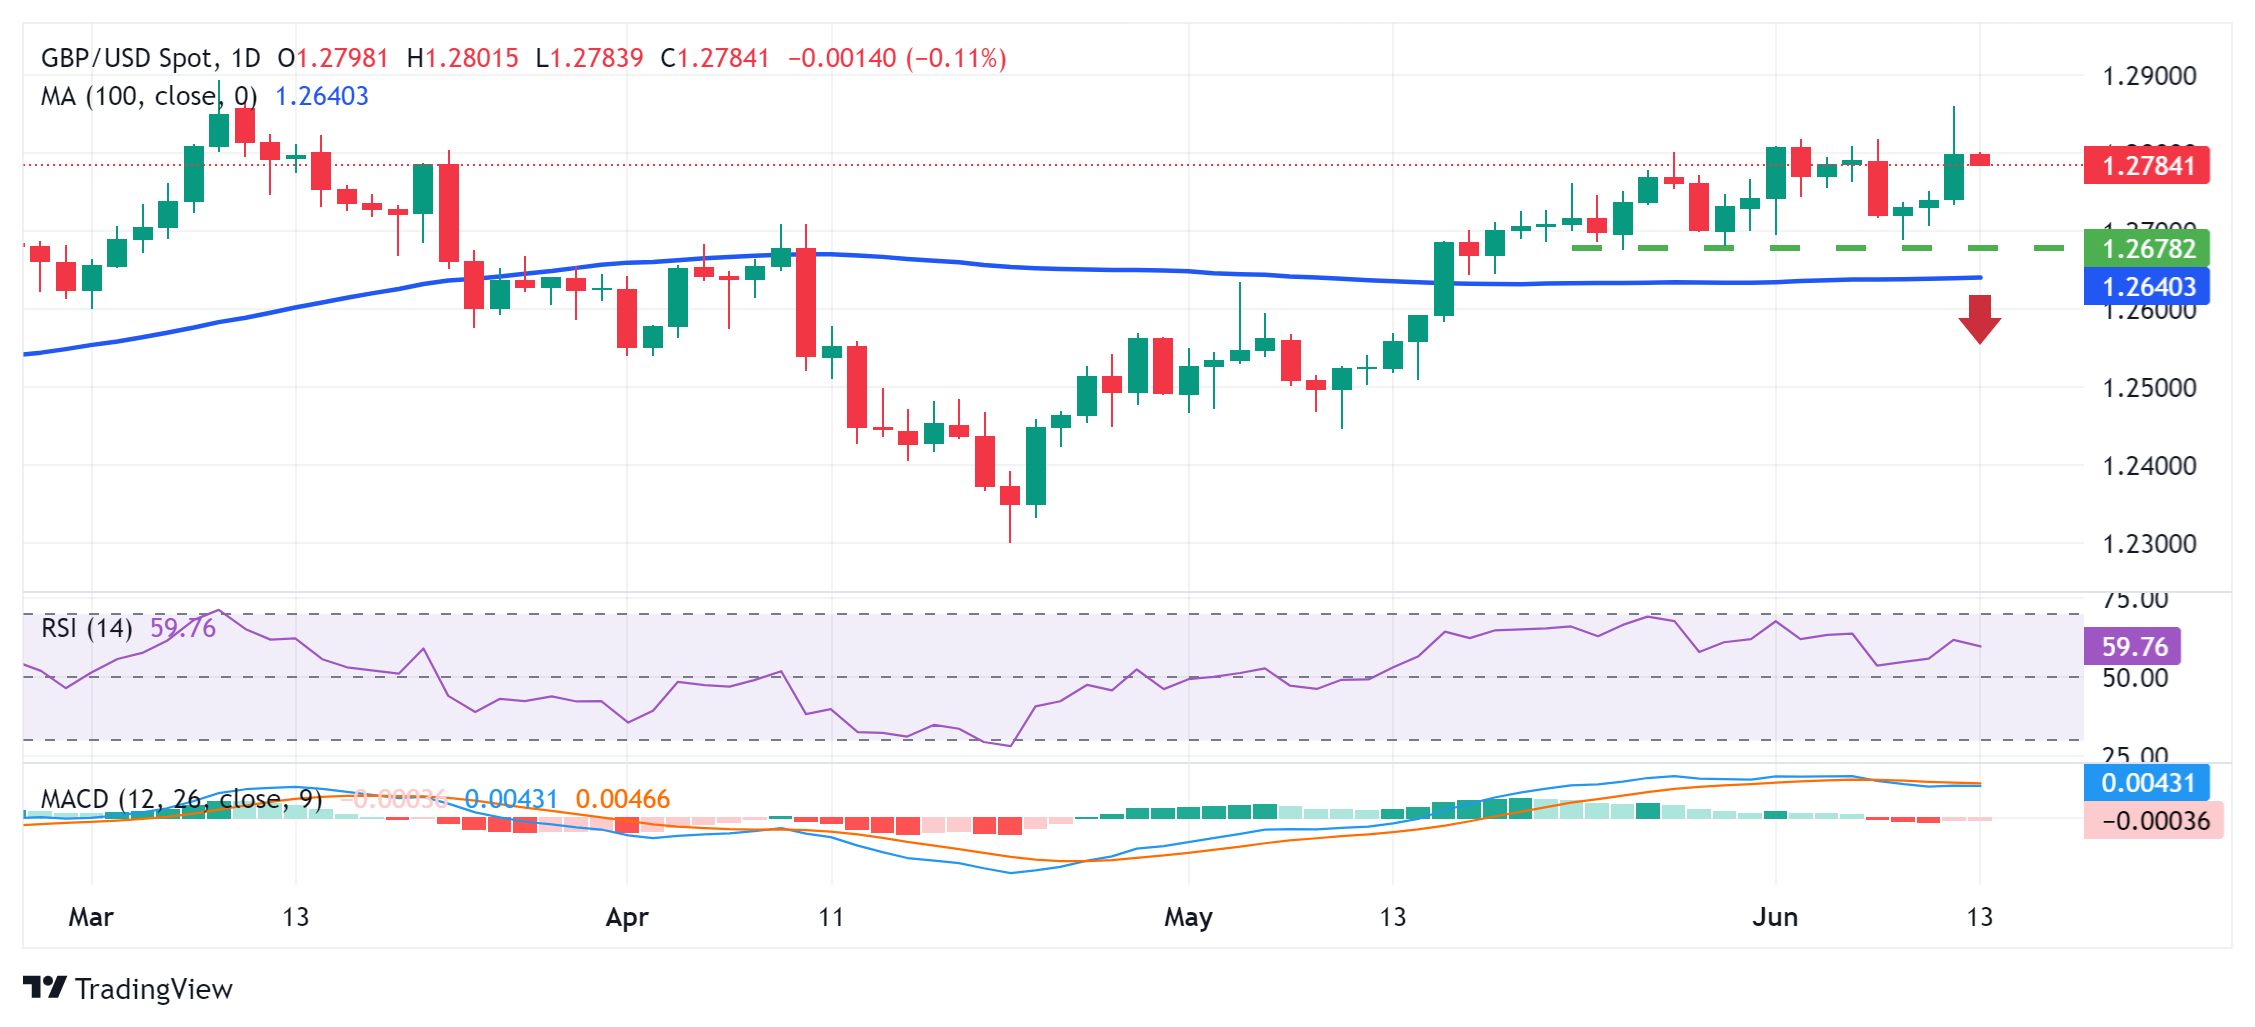
From a technical perspective, the recent repeated failures to find acceptance above the 1.2800 mark warrant some caution for bullish traders ahead of the UK national election on July 4. That said, mixed oscillators on the daily chart make it prudent to wait for strong follow-through selling before confirming that the recent strong rally from the YTD trough touched in April has run its course and positioning for any meaningful depreciating move for the GBP/USD pair.
Meanwhile, any further decline is more likely to find some support near the 1.2755-1.2750 horizontal zone, below which spot prices could slide to the 1.2715-1.2710 intermediate support. The downfall could extend further towards the 1.2690-1.2685 region en route to the 100-day Simple Moving Average (SMA) support, currently pegged near the 1.2640-1.2635 area. A convincing break below the latter will be seen as a fresh trigger for bears and pave the way for further losses.
On the flip side, positive momentum back above the 1.2800 mark might continue to face resistance near the 1.2855-1.2860 region. A sustained strength beyond should allow the GBP/USD pair to retest the YTD peak, around the 1.2900 neighborhood touched in March, and climb further towards the 1.2950 resistance before aiming to reclaim the 1.3000 psychological mark for the first time since July 2023.
GBP/USD daily chart
Information on these pages contains forward-looking statements that involve risks and uncertainties. Markets and instruments profiled on this page are for informational purposes only and should not in any way come across as a recommendation to buy or sell in these assets. You should do your own thorough research before making any investment decisions. FXStreet does not in any way guarantee that this information is free from mistakes, errors, or material misstatements. It also does not guarantee that this information is of a timely nature. Investing in Open Markets involves a great deal of risk, including the loss of all or a portion of your investment, as well as emotional distress. All risks, losses and costs associated with investing, including total loss of principal, are your responsibility. The views and opinions expressed in this article are those of the authors and do not necessarily reflect the official policy or position of FXStreet nor its advertisers.