GBP/USD Price Analysis: Recovery remains elusive below 1.2405 immediate hurdle
|
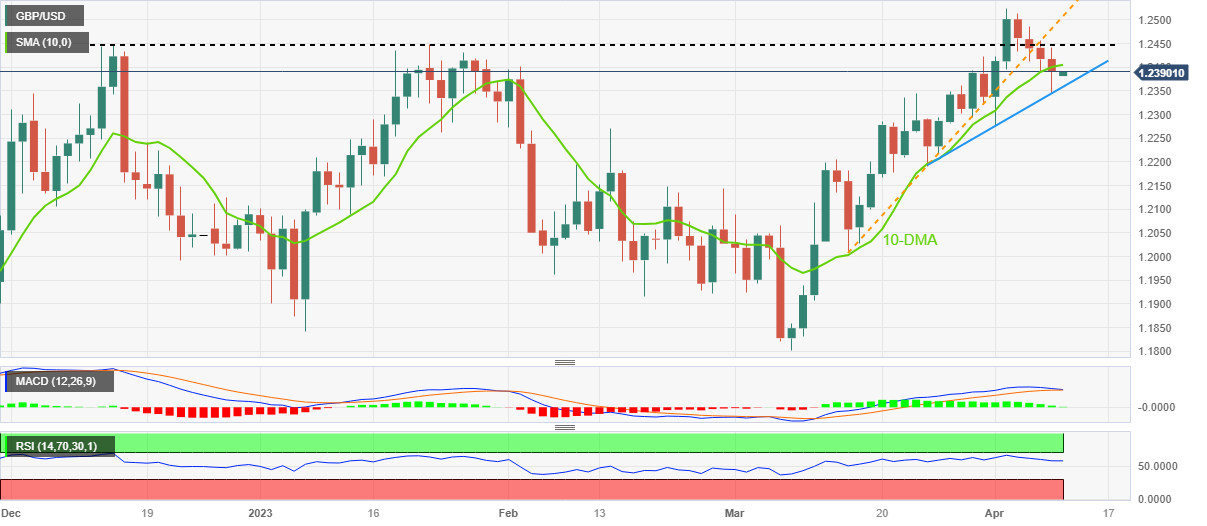
- GBP/USD picks up bids to snap four-day downtrend, bounces off one-week low.
- 10-DMA, looming bear cross on MACD challenges Cable pair buyers.
- 12-day-old ascending support line holds the key to further downside.
GBP/USD prints the first daily gains in five around 1.2390 as full markets return on Tuesday. In doing so, the Cable pair bounces off the lowest levels in a week.
That said, a two-week-old ascending trend line, around 1.2355 by the press time, triggered the GBP/USD pair’s rebound the previous day.
However, the quote’s sustained trading below the 10-DMA hurdle and an impending bear cross on the MACD keeps GBP/USD sellers hopeful. Adding strength to the downside bias is the RSI (14) line’s retreat from the overbought territory.
Hence, the quote’s latest rebound remains elusive unless it stays below the 10-DMA hurdle of 1.2405.
Even if the GBP/USD buyers manage to cross the 1.2405 resistance, a four-month-old horizontal line and previous support trend line stretched from mid-March, respectively near 1.2445 and 1.2510, could challenge the pair’s further upside.
It’s worth noting that the latest multi-month high of 1.2525, marked the last week, also acts as an extra upside filter to watch for Cable buyers.
On the flip side, the aforementioned support line stretched from March 24, close to 1.2355, restricts the immediate downside of the GBP/USD pair, a break of which could quickly drag the quote towards 1.2300 and then to February’s high of near 1.2270.
GBP/USD: Daily chart
Trend: Further downside expected
Information on these pages contains forward-looking statements that involve risks and uncertainties. Markets and instruments profiled on this page are for informational purposes only and should not in any way come across as a recommendation to buy or sell in these assets. You should do your own thorough research before making any investment decisions. FXStreet does not in any way guarantee that this information is free from mistakes, errors, or material misstatements. It also does not guarantee that this information is of a timely nature. Investing in Open Markets involves a great deal of risk, including the loss of all or a portion of your investment, as well as emotional distress. All risks, losses and costs associated with investing, including total loss of principal, are your responsibility. The views and opinions expressed in this article are those of the authors and do not necessarily reflect the official policy or position of FXStreet nor its advertisers.