GBP/USD Price Analysis: Hovers around 1.2750 ahead of UK GDP
|
- GBP/USD may gain ground as technical analysis suggests a bullish bias for the pair.
- The momentum indicator MACD suggests confirmation of a bullish trend for the pair.
- The pair may find immediate support at the 21-day EMA at 1.2712, followed by the lower boundary of the ascending channel at 1.2700.
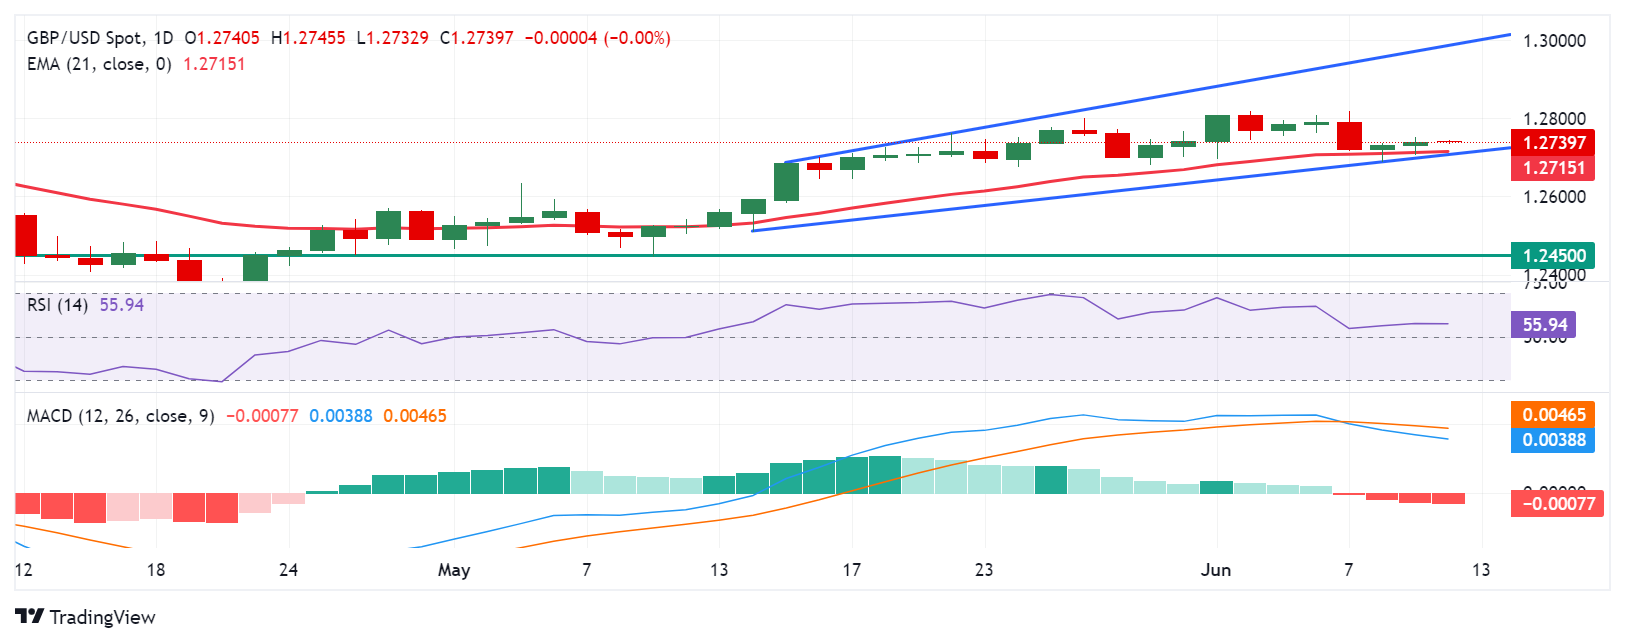
The GBP/USD pair consolidates near 1.2750 during the Asian session on Wednesday. The pair maintains its position within an ascending channel pattern on the daily chart, with the 14-day Relative Strength Index (RSI) above the 50 level, indicating a bullish bias.
Furthermore, the Moving Average Convergence Divergence (MACD) momentum indicator reinforces the bullish trend. The MACD line is above the centerline and diverges above the signal line, suggesting further upward movement.
In terms of resistance, the psychological level of 1.2800 poses a significant barrier. A breakthrough above this level could propel the GBP/USD pair toward testing the upper boundary of the ascending channel around 1.3000.
To the downside, initial support is evident at the 21-day Exponential Moving Average (EMA) situated at 1.2715, with further support lying at the lower boundary of the ascending channel around 1.2700. Should the GBP/USD pair breach this level, it might encounter additional pressure, potentially testing the vicinity of the throwback support at 1.2450.
GBP/USD: Daily Chart
Information on these pages contains forward-looking statements that involve risks and uncertainties. Markets and instruments profiled on this page are for informational purposes only and should not in any way come across as a recommendation to buy or sell in these assets. You should do your own thorough research before making any investment decisions. FXStreet does not in any way guarantee that this information is free from mistakes, errors, or material misstatements. It also does not guarantee that this information is of a timely nature. Investing in Open Markets involves a great deal of risk, including the loss of all or a portion of your investment, as well as emotional distress. All risks, losses and costs associated with investing, including total loss of principal, are your responsibility. The views and opinions expressed in this article are those of the authors and do not necessarily reflect the official policy or position of FXStreet nor its advertisers.